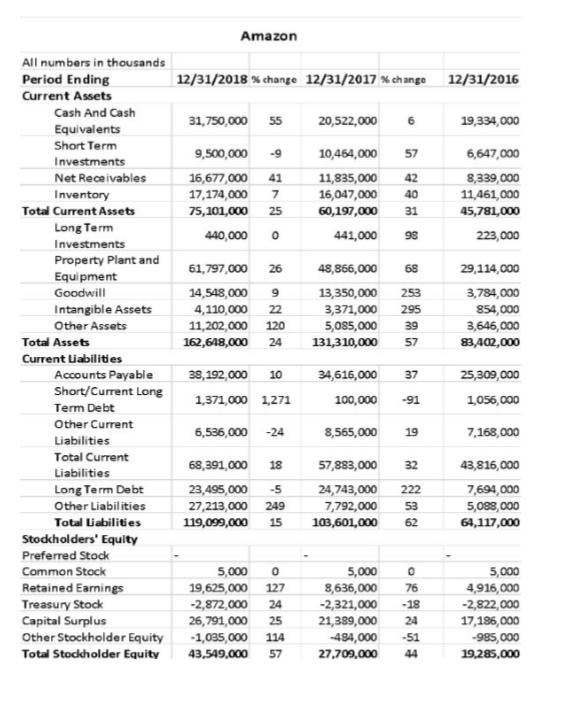
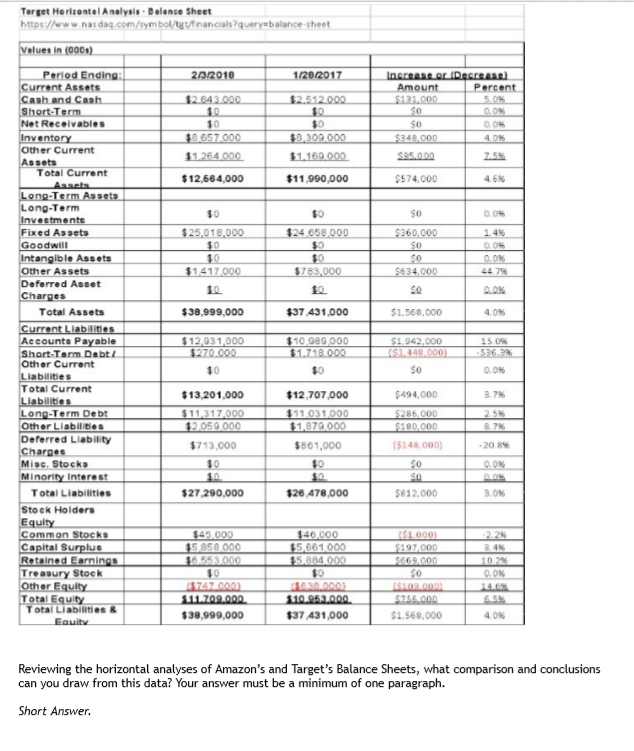
Amazon 12/31/2018 % change 12/31/2017 % change 12/31/2016 31,750,000 55 20,522,000 19,334,000 57 9,500,000 -9 16,677.000 41 17,174,000 7 75, 101,000 25 440,0000 10,454,000 11,835,000 16,047,000 60,197,000 441,000 6,647,000 8,339,000 11,461,000 45,781,000 223,000 31 98 29,114,000 253 61,797,000 14,548,000 4,110,000 11,202,000 162,648,000 9 22 120 24 48,866,000 13,350,000 3,371,000 5,085,000 131,310,000 295 39 57 3,784,000 854,000 3,646,000 83,402,000 All numbers in thousands Period Ending Current Assets Cash And Cash Equivalents Short Term Investments Net Receivables Inventory Total Current Assets Long Term Investments Property Plant and Equipment Goodwill Intangible Assets Other Assets Total Assets Current Liabilities Accounts Payable Short/Current Long Term Debt Other Current Liabilities Total Current Liabilities Long Term Debt Other Liabilities Total Liabilities Stockholders' Equity Preferred Stock Common Stock Retained Earnings Treasury Stock Capital Surplus Other Stockholder Equity Total Stockholder Equity 38,192,000 1,371,000 10 1,271 34,616,000 100,000 25,309,000 1,056,000 -91 19 6,536,000 -24 8,565,000 7,168,000 68,391,000 23,495,000 27,213,000 119,099,000 18 5 249 15 57,883,000 24,743,000 7,792,000 103,601,000 32 222 53 62 43,816,000 7,694,000 5,088,000 64,117,000 0 5,000 19,625,000 -2,872,000 26,791,000 -1,035,000 43,549,000 0 127 24 25 114 57 5,000 8,636,000 -2,321,000 21,389,000 -494,000 27,709,000 5,000 4,916,000 -2,822,000 17,186,000 -985,000 19,285,000 Target Horizontal Analysis Balance Sheet https:/www.nasdaq.com/symbol inancials?query balance sheet Values in (000s) 20/2018 1/28/2017 12.643.000 $2.512.000 Increase or Decrease Amount Percent $131,000 5046 $0 0.0% 0.0% $348.000 $95.00 2.5% So $0 10657 000 $1.264.000 $0 $3,309,000 $1.169.000 $12,664,000 $11.990.000 $574,000 4.6% so 0.0% $ 25,018,000 $24.658.000 SO 0.0% $360,000 SO SO $634,000 10 $1417 000 $763,000 4479 0.0% $38.999,000 $37.431.000 $1.568,000 4.0% Period Ending: Current Assets Cash and Cash Short Term Net Receivables Inventory Other Current Assets Total Current Asset Long-Term Assets Long-Term Investments Fixed Assets Goodwill Intangible Assets Other Assets Deferred Asset Charges Total Assets Current Liabilities Accounts Payable Short Term Dabt/ Other Current Liabilities Total Current Liabilities Long-Term Debt Other Llabilities Deferred Liability Charges Misc. Stocks Minority interest Total Liabilities Stock Holders Equity Common Stocks Capital Surplus Retained Earnings Treasury Stock Other Equity Total Equity Total Liabilities & Equity $12.931 000 $270.000 10 $10 989 000 $1.718.000 $0 $1.942,000 151449000) 15 096 556.3% 0.0% $13,201,000 $11,317,000 $2 059 000 $12.707,000 $11.031.000 $1,879 000 $861,000 $494,000 $286.000 $180,000 15148,000) $0 3.7% 2.5% 8.7% $713,000 10 10 $27.290,000 0.0% $26 478,000 $812,000 3.0% 946.000 $5,661 000 $5.BB4.000 $45.000 35 858 000 16553.000 $0 057247200 $11.709.000 $38,999,000 S1000) $197,00D $669.000 SO SORROR $756.000 $1.568,000 10. 0.0% SARADON $10.952.000 $37 431,000 4.0% Reviewing the horizontal analyses of Amazon's and Target's Balance Sheets, what comparison and conclusions can you draw from this data? Your answer must be a minimum of one paragraph. Short Answer Amazon 12/31/2018 % change 12/31/2017 % change 12/31/2016 31,750,000 55 20,522,000 19,334,000 57 9,500,000 -9 16,677.000 41 17,174,000 7 75, 101,000 25 440,0000 10,454,000 11,835,000 16,047,000 60,197,000 441,000 6,647,000 8,339,000 11,461,000 45,781,000 223,000 31 98 29,114,000 253 61,797,000 14,548,000 4,110,000 11,202,000 162,648,000 9 22 120 24 48,866,000 13,350,000 3,371,000 5,085,000 131,310,000 295 39 57 3,784,000 854,000 3,646,000 83,402,000 All numbers in thousands Period Ending Current Assets Cash And Cash Equivalents Short Term Investments Net Receivables Inventory Total Current Assets Long Term Investments Property Plant and Equipment Goodwill Intangible Assets Other Assets Total Assets Current Liabilities Accounts Payable Short/Current Long Term Debt Other Current Liabilities Total Current Liabilities Long Term Debt Other Liabilities Total Liabilities Stockholders' Equity Preferred Stock Common Stock Retained Earnings Treasury Stock Capital Surplus Other Stockholder Equity Total Stockholder Equity 38,192,000 1,371,000 10 1,271 34,616,000 100,000 25,309,000 1,056,000 -91 19 6,536,000 -24 8,565,000 7,168,000 68,391,000 23,495,000 27,213,000 119,099,000 18 5 249 15 57,883,000 24,743,000 7,792,000 103,601,000 32 222 53 62 43,816,000 7,694,000 5,088,000 64,117,000 0 5,000 19,625,000 -2,872,000 26,791,000 -1,035,000 43,549,000 0 127 24 25 114 57 5,000 8,636,000 -2,321,000 21,389,000 -494,000 27,709,000 5,000 4,916,000 -2,822,000 17,186,000 -985,000 19,285,000 Target Horizontal Analysis Balance Sheet https:/www.nasdaq.com/symbol inancials?query balance sheet Values in (000s) 20/2018 1/28/2017 12.643.000 $2.512.000 Increase or Decrease Amount Percent $131,000 5046 $0 0.0% 0.0% $348.000 $95.00 2.5% So $0 10657 000 $1.264.000 $0 $3,309,000 $1.169.000 $12,664,000 $11.990.000 $574,000 4.6% so 0.0% $ 25,018,000 $24.658.000 SO 0.0% $360,000 SO SO $634,000 10 $1417 000 $763,000 4479 0.0% $38.999,000 $37.431.000 $1.568,000 4.0% Period Ending: Current Assets Cash and Cash Short Term Net Receivables Inventory Other Current Assets Total Current Asset Long-Term Assets Long-Term Investments Fixed Assets Goodwill Intangible Assets Other Assets Deferred Asset Charges Total Assets Current Liabilities Accounts Payable Short Term Dabt/ Other Current Liabilities Total Current Liabilities Long-Term Debt Other Llabilities Deferred Liability Charges Misc. Stocks Minority interest Total Liabilities Stock Holders Equity Common Stocks Capital Surplus Retained Earnings Treasury Stock Other Equity Total Equity Total Liabilities & Equity $12.931 000 $270.000 10 $10 989 000 $1.718.000 $0 $1.942,000 151449000) 15 096 556.3% 0.0% $13,201,000 $11,317,000 $2 059 000 $12.707,000 $11.031.000 $1,879 000 $861,000 $494,000 $286.000 $180,000 15148,000) $0 3.7% 2.5% 8.7% $713,000 10 10 $27.290,000 0.0% $26 478,000 $812,000 3.0% 946.000 $5,661 000 $5.BB4.000 $45.000 35 858 000 16553.000 $0 057247200 $11.709.000 $38,999,000 S1000) $197,00D $669.000 SO SORROR $756.000 $1.568,000 10. 0.0% SARADON $10.952.000 $37 431,000 4.0% Reviewing the horizontal analyses of Amazon's and Target's Balance Sheets, what comparison and conclusions can you draw from this data? Your answer must be a minimum of one paragraph. Short