Ambaji123
please answer all the questions below:
thank you. please read the comments.
i)
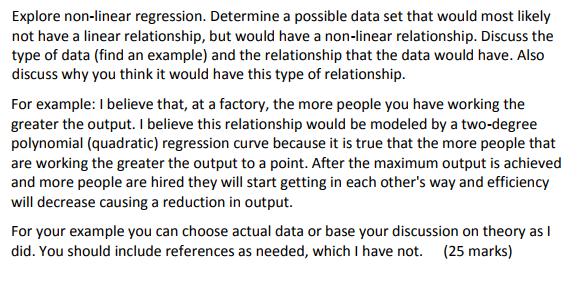
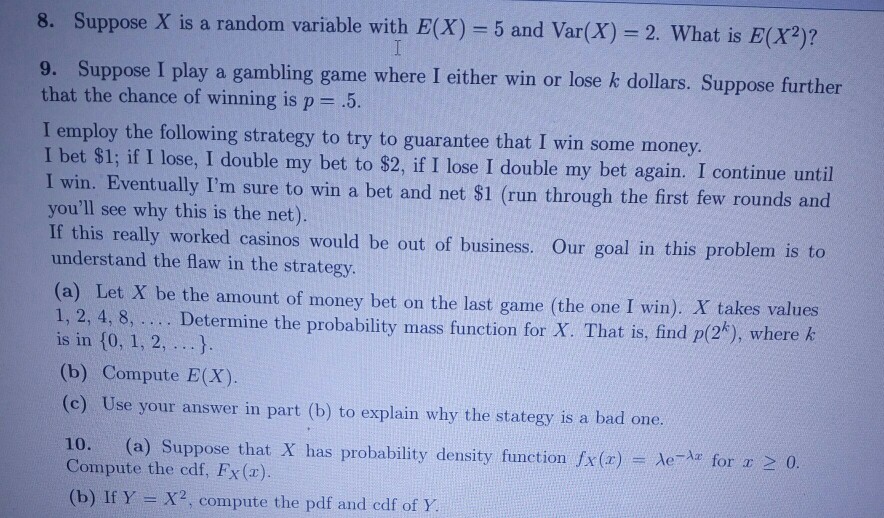
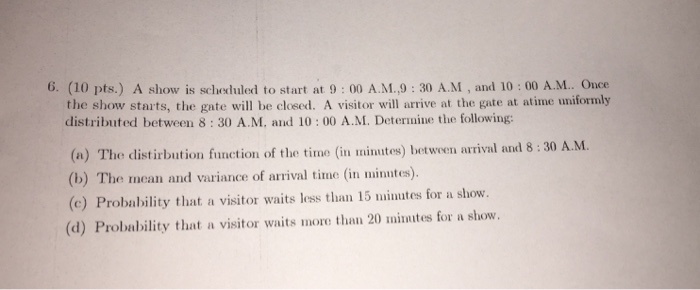
Explore non-linear regression. Determine a possible data set that would most likely not have a linear relationship. but would have a non-linear relationship. Discuss the type of data [nd an example} and the relationship that the data would have. Also discuss why you thinlr. It would have this type of relationship. For example: I believe that, at a factory. the more people you have working the greater the output. I believe this relationship would be modeled by a two-degree polynomial [quadratic] regression more because It is true that the more people that are working the greater the output to a point. After the maximum output is achieved and more people are hired they will start getting in each other's way and efficiency will decrease causing a reduction in output. For your example you can choose actual data or base your discussion on theory as I did. You should include references as needed. which I have not. (15 marks} 8. Suppose X is a random variable with E(X) = 5 and Var(X) = 2. What is E(X?)? I 9. Suppose I play a gambling game where I either win or lose k dollars. Suppose further that the chance of winning is p = .5. I employ the following strategy to try to guarantee that I win some money. I bet $1; if I lose, I double my bet to $2, if I lose I double my bet again. I continue until I win. Eventually I'm sure to win a bet and net $1 (run through the first few rounds and you'll see why this is the net). If this really worked casinos would be out of business. Our goal in this problem is to understand the flaw in the strategy. (a) Let X be the amount of money bet on the last game (the one I win). X takes values 1, 2, 4, 8, .... Determine the probability mass function for X. That is, find p(2*), where k is in {0, 1, 2, . .. }. (b) Compute E(X). (c) Use your answer in part (b) to explain why the stategy is a bad one. 10. (a) Suppose that X has probability density function fx(r) = de- for r 2 0. Compute the cdf, Fx (x). (b) If Y - X2, compute the pdf and cdf of Y.1. At the national level, the average income for a given occupation is $74 914. You want to determine if the income for member of the occupation is the same in Kamloops. You take a random sample of 112 members of the occupation in Kamloops. You find that mean of your sample is $78 695. Assume that the population standard deviation is $14 530. (a) (7 marks) State the hypotheses and test them with the critical value approach and a significance level of a = 0.05. (b) (2 marks) What is the p-value of the test statistic? (c) (4 marks) What is the 95% confidence interval for u?Exercise 6.36. Suppose that X, Y are jointly continuous with joint probability density function f(x, y) = ce 2 22 _ (x-y)2 2 x , y E ( -0o, 00) , for some constant c. (a) Find the value of the constant c. (b) Find the marginal density functions of X and Y. (c) Determine whether X and Y are independent.6. (10 pts.) A show is scheduled to start at 9: 00 A.M.,9 : 30 A.M, and 10 : 00 A.M.. Once the show starts, the gate will be closed. A visitor will arrive at the gate at atime uniformly distributed between 8 : 30 A.M. and 10 : 00 A.M. Determine the following: (a) The distirbution function of the time (in minutes) between arrival and 8 : 30 A.M. (b) The mean and variance of arrival time (in minutes). (c) Probability that a visitor waits less than 15 minutes for a show. (d) Probability that a visitor waits more than 20 minutes for a show


