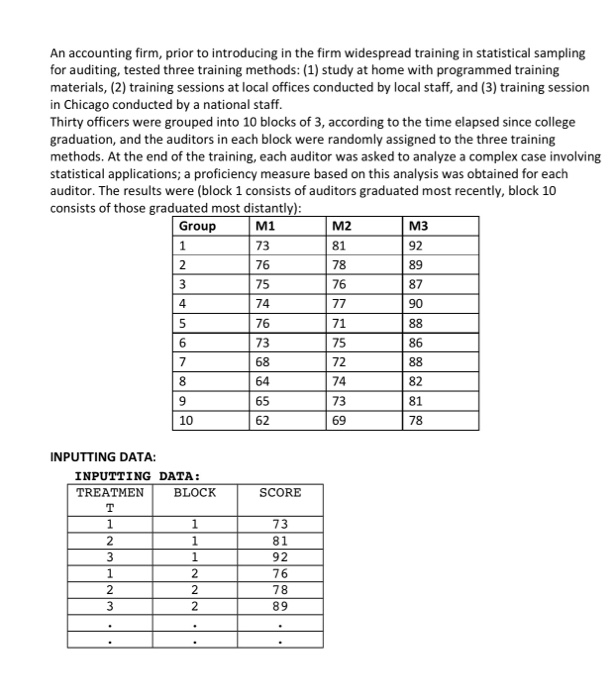
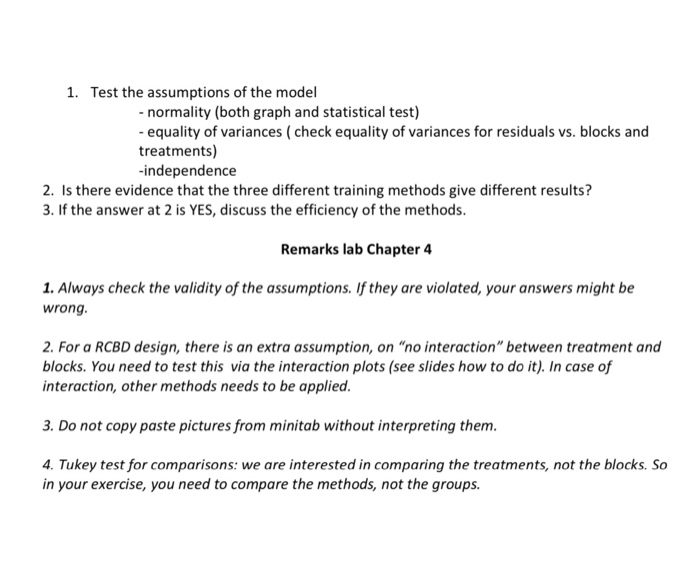
An accounting firm, prior to introducing in the firm widespread training in statistical sampling for auditing, tested three training methods: (1) study at home with programmed training materials, (2) training sessions at local offices conducted by local staff, and (3) training session in Chicago conducted by a national staff. Thirty officers were grouped into 10 blocks of 3, according to the time elapsed since college graduation, and the auditors in each block were randomly assigned to the three training methods. At the end of the training, each auditor was asked to analyze a complex case involving statistical applications; a proficiency measure based on this analysis was obtained for each auditor. The results were (block 1 consists of auditors graduated most recently, block 10 consists of those graduated most distantly): Group M1 M2 M3 73 1 81 92 76 78 89 2 3 4 76 87 75 74 77 90 76 88 5 6 71 75 86 7 72 88 73 68 64 65 8 74 82 81 9 73 10 62 69 78 SCORE INPUTTING DATA: INPUTTING DATA: TREATMEN BLOCK T 1 1 2 1 3 1 1 2 2 2 3 2 73 81 92 76 78 89 1. Test the assumptions of the model - normality (both graph and statistical test) - equality of variances (check equality of variances for residuals vs. blocks and treatments) -independence 2. Is there evidence that the three different training methods give different results? 3. If the answer at 2 is YES, discuss the efficiency of the methods. Remarks lab Chapter 4 1. Always check the validity of the assumptions. If they are violated, your answers might be wrong. 2. For a RCBD design, there is an extra assumption, on "no interaction" between treatment and blocks. You need to test this via the interaction plots (see slides how to do it). In case of interaction, other methods needs to be applied. 3. Do not copy paste pictures from minitab without interpreting them. 4. Tukey test for comparisons: we are interested in comparing the treatments, not the blocks. So in your exercise, you need to compare the methods, not the groups. An accounting firm, prior to introducing in the firm widespread training in statistical sampling for auditing, tested three training methods: (1) study at home with programmed training materials, (2) training sessions at local offices conducted by local staff, and (3) training session in Chicago conducted by a national staff. Thirty officers were grouped into 10 blocks of 3, according to the time elapsed since college graduation, and the auditors in each block were randomly assigned to the three training methods. At the end of the training, each auditor was asked to analyze a complex case involving statistical applications; a proficiency measure based on this analysis was obtained for each auditor. The results were (block 1 consists of auditors graduated most recently, block 10 consists of those graduated most distantly): Group M1 M2 M3 73 1 81 92 76 78 89 2 3 4 76 87 75 74 77 90 76 88 5 6 71 75 86 7 72 88 73 68 64 65 8 74 82 81 9 73 10 62 69 78 SCORE INPUTTING DATA: INPUTTING DATA: TREATMEN BLOCK T 1 1 2 1 3 1 1 2 2 2 3 2 73 81 92 76 78 89 1. Test the assumptions of the model - normality (both graph and statistical test) - equality of variances (check equality of variances for residuals vs. blocks and treatments) -independence 2. Is there evidence that the three different training methods give different results? 3. If the answer at 2 is YES, discuss the efficiency of the methods. Remarks lab Chapter 4 1. Always check the validity of the assumptions. If they are violated, your answers might be wrong. 2. For a RCBD design, there is an extra assumption, on "no interaction" between treatment and blocks. You need to test this via the interaction plots (see slides how to do it). In case of interaction, other methods needs to be applied. 3. Do not copy paste pictures from minitab without interpreting them. 4. Tukey test for comparisons: we are interested in comparing the treatments, not the blocks. So in your exercise, you need to compare the methods, not the groups


