

Question
An agency is considering two alternatives for a roadway location and design project, A1 and A2. Alternatives A1 and A2 are to be evaluated according
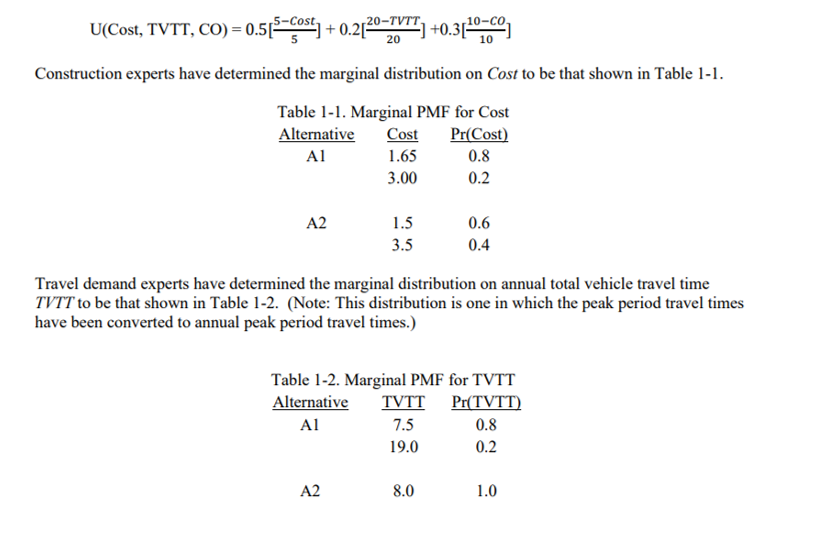
An agency is considering two alternatives for a roadway location and design project, A1 and A2. Alternatives A1 and A2 are to be evaluated according to a three-dimensional outcome (Cost, TVTT, CO), where Cost is the present value of cost (in units of $108 ), TVTT is the annual total peak period vehicle travel time (in units of 106 vehicle-hours), and CO is the carbon monoxide concentrations resulting from the traffic during the peak period (in units of 10-1 parts per million).
Use the following utility function:
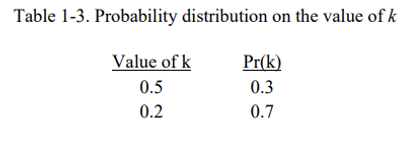
Environmental experts are predicting the CO level from the TVTT value. In this simplified problem, they believe that this prediction can be made according to the following equation: CO = k TVTT They are uncertain about the value of k. They believe that this value does not depend on the alternative or on the value of TVTT and express their uncertainty about the value by the probability distribution presented in Table 1-3.
As a first approximation, it is assumed that the value of TVTT and CO are independent of the values of Cost. That is, Pr(Cost, TVTT, CO) = P(Cost) x P(TVTT,CO). One wishes to choose the alternative, A1 or A2, that maximizes the expected utility associated with (Cost, TVTT, CO) outcomes.
1a. Draw the branch of the decision tree associated with choosing Alternative A1. Show values of Cost, TVTT, k, CO, associated probabilities, and outcomes (COST, TVTT, CO) in the appropriate place.
1b. Show that EU(A1) = 0.62474
1c. Draw the branch of the decision tree associated with choosing Alternative A2. Show values of Cost, TVTT, k, CO, associated probabilities, and outcomes (COST, TVTT, CO) in the appropriate place. Do not clutter the diagram with utilities or with calculations.
1d. Show that EU(A2) = 0.620400
TUTT U(Cost, TVTT, CO) = 0.525-cost] +0.2720-2OTT) +0.31101760 Construction experts have determined the marginal distribution on Cost to be that shown in Table 1-1. Table 1-1. Marginal PMF for Cost Alternative Cost Pr(Cost) 1.65 0.8 3.00 0.2 A2 1.5 3.5 0.6 0.4 Travel demand experts have determined the marginal distribution on annual total vehicle travel time TVTT to be that shown in Table 1-2. (Note: This distribution is one in which the peak period travel times have been converted to annual peak period travel times.) Table 1-2. Marginal PMF for TVTT Alternative TVTT Pr(TVTT) 0.8 19.0 0.2 7.5 A2 8.0 1.0 Table 1-3. Probability distribution on the value of k Value of k 0.5 0.2 Pr(k) 0.3 0.7 TUTT U(Cost, TVTT, CO) = 0.525-cost] +0.2720-2OTT) +0.31101760 Construction experts have determined the marginal distribution on Cost to be that shown in Table 1-1. Table 1-1. Marginal PMF for Cost Alternative Cost Pr(Cost) 1.65 0.8 3.00 0.2 A2 1.5 3.5 0.6 0.4 Travel demand experts have determined the marginal distribution on annual total vehicle travel time TVTT to be that shown in Table 1-2. (Note: This distribution is one in which the peak period travel times have been converted to annual peak period travel times.) Table 1-2. Marginal PMF for TVTT Alternative TVTT Pr(TVTT) 0.8 19.0 0.2 7.5 A2 8.0 1.0 Table 1-3. Probability distribution on the value of k Value of k 0.5 0.2 Pr(k) 0.3 0.7Step by Step Solution
There are 3 Steps involved in it
Step: 1

Get Instant Access to Expert-Tailored Solutions
See step-by-step solutions with expert insights and AI powered tools for academic success
Step: 2

Step: 3
Ace Your Homework with AI
Get the answers you need in no time with our AI-driven, step-by-step assistance
Get Started
Public Finance
Authors: Harvey S. Rosen
3rd Edition
0256083762, 978-0256083767