

Answered step by step
Verified Expert Solution
Question
1 Approved Answer
An analysis of motor vehicles in accidents on high-speed sections of highway in the state of NSW was undertaken to see if there was
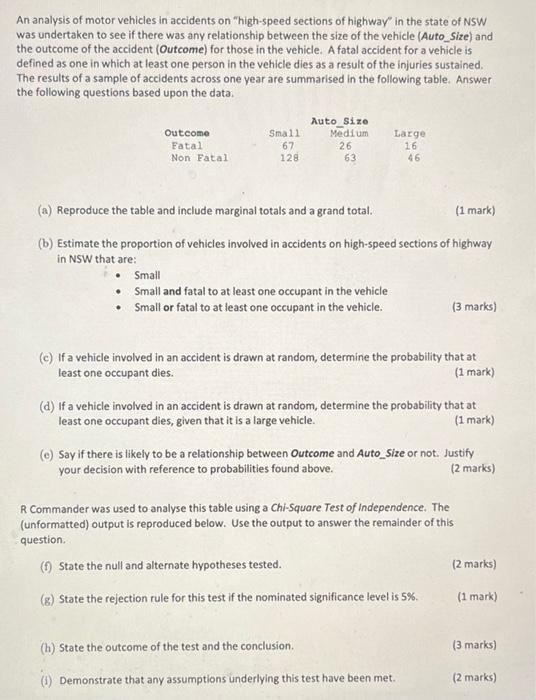
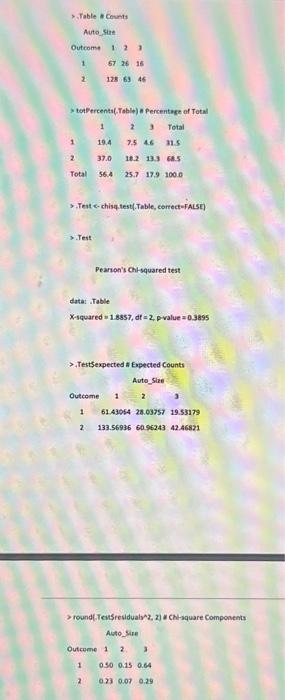
An analysis of motor vehicles in accidents on "high-speed sections of highway" in the state of NSW was undertaken to see if there was any relationship between the size of the vehicle (Auto_Size) and the outcome of the accident (Outcome) for those in the vehicle. A fatal accident for a vehicle is defined as one in which at least one person in the vehicle dies as a result of the injuries sustained. The results of a sample of accidents across one year are summarised in the following table. Answer the following questions based upon the data. Outcome Fatal Non Fatal Small 67 128 Auto Size Medium 26 63 Large 16 (a) Reproduce the table and include marginal totals and a grand total. (b) Estimate the proportion of vehicles involved in accidents on high-speed sections of highway in NSW that are: Small Small and fatal to at least one occupant in the vehicle Small or fatal to at least one occupant in the vehicle. 46 (1 mark) (3 marks) (c) If a vehicle involved in an accident is drawn at random, determine the probability that at least one occupant dies. (1 mark) (d) If a vehicle involved in an accident is drawn at random, determine the probability that at least one occupant dies, given that it is a large vehicle. (1 mark) (h) State the outcome of the test and the conclusion. (1) Demonstrate that any assumptions underlying this test have been met. (e) Say if there is likely to be a relationship between Outcome and Auto_Size or not. Justify your decision with reference to probabilities found above. (2 marks) R Commander was used to analyse this table using a Chi-Square Test of Independence. The (unformatted) output is reproduced below. Use the output to answer the remainder of this question. (f) State the null and alternate hypotheses tested. (g) State the rejection rule for this test if the nominated significance level is 5%. (2 marks) (1 mark) (3 marks) (2 marks) > Table Auto Size Outcome 121 1 2 1 2 Total >totPercents( Table) # Percentage of Total 1 23 Total 19.4 7.5 4.6 31.5 37.0 18.2 13.3 68.5 56.4 25.7 17.9 100.0 > Test Counts >Test-chisq.test( Table, correct-FALSE) 67 26 15 128 63 46 11 data: Table X-squared =1.8857, df = 2, p-value=0.3895 2 Pearson's Chi-squared test > TestSexpected # Expected Counts Auto_Size Outcome 1 1 1 2 2 >round(.Test$residuals^2, 2) # Chi-square Components Auto Sie 61.43064 28.03757 19.53179 133.56936 60.96243 42.46821 Outcome 1 2 3 0.50 0.15 0.64 0.23 0.07 0.29
Step by Step Solution
★★★★★
3.49 Rating (152 Votes )
There are 3 Steps involved in it
Step: 1
SOLUTION a EXPLANATION bi EXPLANATI...
Get Instant Access to Expert-Tailored Solutions
See step-by-step solutions with expert insights and AI powered tools for academic success
Step: 2

Step: 3
Ace Your Homework with AI
Get the answers you need in no time with our AI-driven, step-by-step assistance
Get Started
Statistics For The Life Sciences
Authors: Myra Samuels, Jeffrey Witmer, Andrew Schaffner
5th Edition
321989589, 978-0321989581