

Question
An analyst has estimated the following pro-forma income statements and balance sheets for the years 2015-2019 for the company SILIPHONE Inc.: The analyst tells you
An analyst has estimated the following pro-forma income statements and balance sheets for the years 2015-2019 for the company SILIPHONE Inc.:
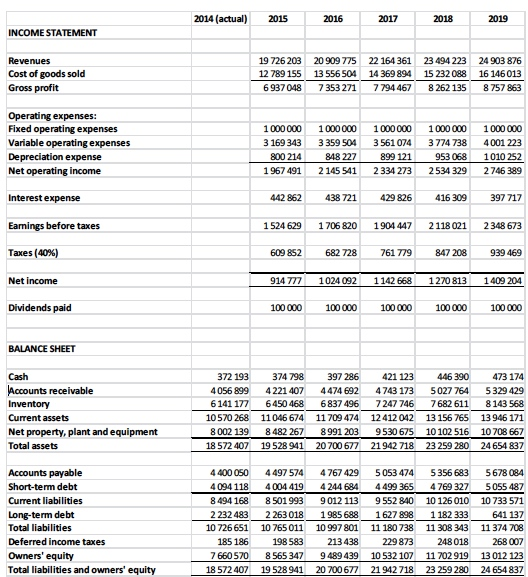
The analyst tells you that the cash earn a fair market value. The firms interest-bearing debt consists of short-term debt and long-term debt. The analyst is using a weighted average cost of capital (WACC) of 10% and he believes the long-term growth rate in free cash flows will equal 5%.
Free cash flow 2015-2019
| Free Cash Flow | (7 235 857) | (7 304 564) | (7 650 727) | (8 050 188) | (9 878 851) |
- Compute both the enterprise value and the equity value of SILIPHONE.
- Assume now, that instead of being a going concern, the firms free cash flows are expected to grow by 5% for 5 years (after the terminal year), then remain at that level for further five years before the firm ceases operations, at which point they sell all assets for 10 million. What is the value of the firm?
2014 (actual) 2015 2016 2017 2018 2019 INCOME STATEMENT Revenues Cost of goods sold Gross profit 19 726 203 12 789 155 6937 048 20 909 775 13 556 504 7353 271 22 164 361 14 369 894 7794 467 23 494 223 15 232 088 8 262 135 24 903 876 16 146 013 8 757 863 Operating expenses: Fixed operating expenses Variable operating expenses Depreciation expense Net operating income 1 000 000 3 169 343 800 214 1 967 491 1000000 3359 504 848 227 2145 541 1000000 3 561 074 899 121 2334 273 1000000 3 774 738 953 068 2534 329 1000 000 4001 223 1010 252 2746 389 Interest expense 442 862 438 721 429 826 416 309 397 717 Earnings before taxes 1 524 629 1706 820 1904 447 2118 021 2348 673 Taxes (40%) 609 852 682 728 761 779 847 208 939 469 Net income 914 777 1024 092 1142 668 1270 813 1409 204 Dividends paid 100 000 100 000 100 000 100 000 100 000 BALANCE SHEET Cash Accounts receivable Inventory Current assets Net property, plant and equipment Total assets 372 193 374 798 397 286 4056 8994221 407 4474 692 6141 177 6450 468 6837 496 10570 268 11046 674 11 709 474 8 002 139 8482 267 8991 203 18 572 407 19 528 941 20 700 677 421 123 4743 173 7247 746 12 412 042 9530 675 21 942 718 446 390 5027 764 7682 611 13 156 765 10 102 516 23 259 280 473 174 5329 429 8143 568 13 946 171 10 708 667 24654 837 Accounts payable Short-term debt Current liabilities Long-term debt Total liabilities Deferred income taxes Owners' equity Total liabilities and owners' equity 4 400 050 4094 118 8 494 168 2 232 483 10 726 651 185 186 7 660 570 18 572 407 4497 574 4 767 429 4004 419 4244 684 8501 993 9012 113 2 263 018 1985 688 10 765 011 10 997 801 198 583 213 438 8 565 3479 489 439 19 528 941 20 700 677 5053 474 4499 365 9552 840 1627 898 11 180 738 229 873 10 532 107 21 942 718 5356 683 4769 327 10 126 010 1182 333 11 308 343 248 018 11 702 919 23 259 280 5678 084 5055 487 10 733 571 641 137 11 374 708 268 007 13 012 123 24654837 2014 (actual) 2015 2016 2017 2018 2019 INCOME STATEMENT Revenues Cost of goods sold Gross profit 19 726 203 12 789 155 6937 048 20 909 775 13 556 504 7353 271 22 164 361 14 369 894 7794 467 23 494 223 15 232 088 8 262 135 24 903 876 16 146 013 8 757 863 Operating expenses: Fixed operating expenses Variable operating expenses Depreciation expense Net operating income 1 000 000 3 169 343 800 214 1 967 491 1000000 3359 504 848 227 2145 541 1000000 3 561 074 899 121 2334 273 1000000 3 774 738 953 068 2534 329 1000 000 4001 223 1010 252 2746 389 Interest expense 442 862 438 721 429 826 416 309 397 717 Earnings before taxes 1 524 629 1706 820 1904 447 2118 021 2348 673 Taxes (40%) 609 852 682 728 761 779 847 208 939 469 Net income 914 777 1024 092 1142 668 1270 813 1409 204 Dividends paid 100 000 100 000 100 000 100 000 100 000 BALANCE SHEET Cash Accounts receivable Inventory Current assets Net property, plant and equipment Total assets 372 193 374 798 397 286 4056 8994221 407 4474 692 6141 177 6450 468 6837 496 10570 268 11046 674 11 709 474 8 002 139 8482 267 8991 203 18 572 407 19 528 941 20 700 677 421 123 4743 173 7247 746 12 412 042 9530 675 21 942 718 446 390 5027 764 7682 611 13 156 765 10 102 516 23 259 280 473 174 5329 429 8143 568 13 946 171 10 708 667 24654 837 Accounts payable Short-term debt Current liabilities Long-term debt Total liabilities Deferred income taxes Owners' equity Total liabilities and owners' equity 4 400 050 4094 118 8 494 168 2 232 483 10 726 651 185 186 7 660 570 18 572 407 4497 574 4 767 429 4004 419 4244 684 8501 993 9012 113 2 263 018 1985 688 10 765 011 10 997 801 198 583 213 438 8 565 3479 489 439 19 528 941 20 700 677 5053 474 4499 365 9552 840 1627 898 11 180 738 229 873 10 532 107 21 942 718 5356 683 4769 327 10 126 010 1182 333 11 308 343 248 018 11 702 919 23 259 280 5678 084 5055 487 10 733 571 641 137 11 374 708 268 007 13 012 123 24654837Step by Step Solution
There are 3 Steps involved in it
Step: 1

Get Instant Access to Expert-Tailored Solutions
See step-by-step solutions with expert insights and AI powered tools for academic success
Step: 2

Step: 3
Ace Your Homework with AI
Get the answers you need in no time with our AI-driven, step-by-step assistance
Get Started
Behavioral Finance And Investor Types
Authors: Michael M. Pompian
1st Edition
1118011503, 978-1118011508