Answered step by step
Verified Expert Solution
Link Copied!

Question

1 Approved Answer

An article contained the following observations on degree of polymerization for paper specimens for which viscosity times concentration fell in a certain middle range: 418
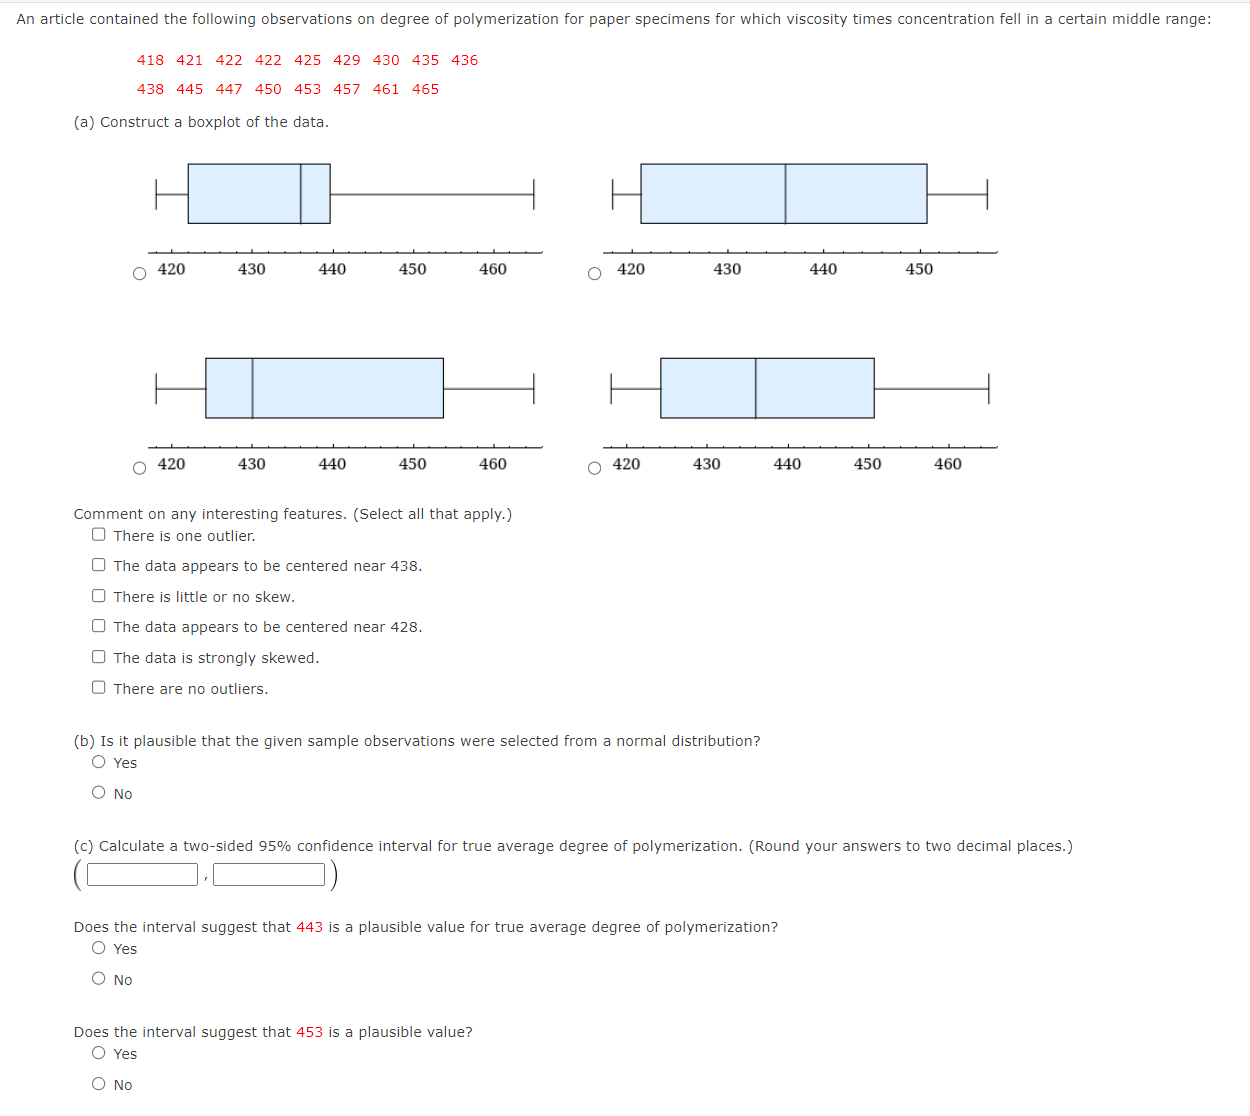
image text in transcribed
An article contained the following observations on degree of polymerization for paper specimens for which viscosity times concentration fell in a certain middle range: 418 421 422 422 425 429 430 435 436 438 445 447 450 453 457 461 465 (a) Construct a boxplot of the data. O 420 430 440 450 460 420 430 440 450 O 420 430 440 450 460 O 420 430 440 450 460 Comment on any interesting features. (Select all that apply.) There is one outlier. O The data appears to be centered near 438. O There is little or no skew. O The data appears to be centered near 428. O The data is strongly skewed. O There are no outliers. (b) Is it plausible that the given sample observations were selected from a normal distribution? O Yes O No (c) Calculate a two-sided 95% confidence interval for true average degree of polymerization. (Round your answers to two decimal places.) Does the interval suggest that 443 is a plausible value for true average degree of polymerization? O Yes O NO Does the interval suggest that 453 is a plausible value? O Yes O NO

Step by Step Solution

There are 3 Steps involved in it

Step: 1

blur-text-image

Get Instant Access to Expert-Tailored Solutions

See step-by-step solutions with expert insights and AI powered tools for academic success

Step: 2

blur-text-image

Step: 3

blur-text-image

Ace Your Homework with AI

Get the answers you need in no time with our AI-driven, step-by-step assistance

Get Started

Recommended Textbook for

Quantitative Analysis For Management

Authors: Barry Render, Ralph M. Stair, Michael E. Hanna

11th Edition

9780132997621, 132149117, 132997622, 978-0132149112

Students also viewed these Mathematics questions