Answered step by step
Verified Expert Solution
Question
1 Approved Answer
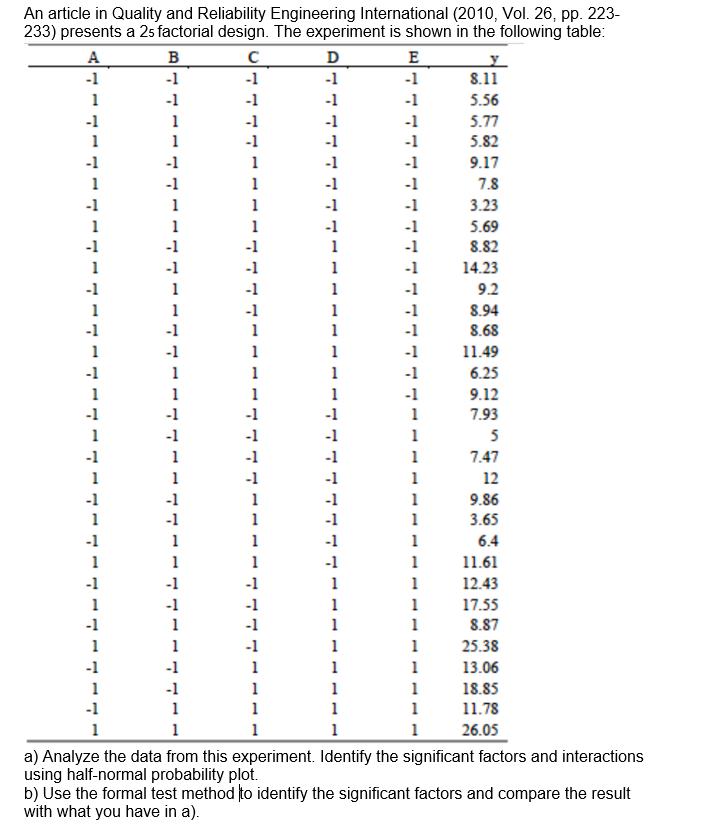
An article in Quality and Reliability Engineering International (2010, Vol. 26, pp. 223- 233) presents a 25 factorial design. The experiment is shown in

An article in Quality and Reliability Engineering International (2010, Vol. 26, pp. 223- 233) presents a 25 factorial design. The experiment is shown in the following table: A -1 1 -1 1 -1 1 -1 1 -1 1 -1 1 -1 1 -1 1 -1 1 -1 1 -1 1 -1 1 -1 1 -1 1 -1 1 -1 1 B -1 -1 1 1 -1 1 1 -1 1 1 1 1 -1 1 1 -1 -1 1 1 -1 1 1 -1 1 1 C -1 -1 -1 -1 1 1 1 -1 -1 1 1 -1 1 1 1 -1 -1 1 1 1 1 D -1 -1 -1 -1 -1 1 1 1 1 1 -1 1 1 1 1 1 1 1 1 E -1 -1 -1 -1 -1 -1 -1 -1 1 1 1 1 1 1 1 1 1 1 1 1 1 1 1 8.11 5.56 5.77 5.82 9.17 7.8 3.23 5.69 8.82 14.23 9.2 8.94 8.68 11.49 6.25 9.12 7.93 5 7.47 12 9.86 3.65 6.4 11.61 12.43 17.55 8.87 25.38 13.06 18.85 11.78 26.05 a) Analyze the data from this experiment. Identify the significant factors and interactions using half-normal probability plot. b) Use the formal test method to identify the significant factors and compare the result with what you have in a).
Step by Step Solution
★★★★★
3.40 Rating (156 Votes )
There are 3 Steps involved in it
Step: 1
Main effect D E A are significant interaction AD DE BEAB ABEAE ADE are significant Factorial Fit y v...
Get Instant Access to Expert-Tailored Solutions
See step-by-step solutions with expert insights and AI powered tools for academic success
Step: 2

Step: 3

Ace Your Homework with AI
Get the answers you need in no time with our AI-driven, step-by-step assistance
Get Started


