Question
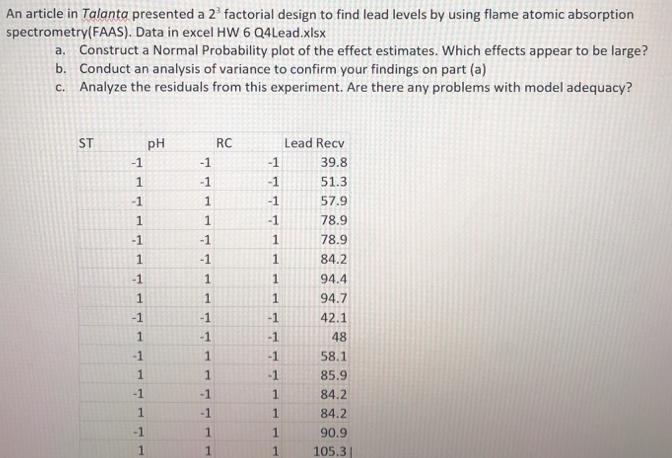
An article in Talanta presented a 2 factorial design to find lead levels by using flame atomic absorption spectrometry(FAAS). Data in excel HW 6

An article in Talanta presented a 2 factorial design to find lead levels by using flame atomic absorption spectrometry(FAAS). Data in excel HW 6 Q4Lead.xlsx a. Construct a Normal Probability plot of the effect estimates. Which effects appear to be large? b. Conduct an analysis of variance to confirm your findings on part (a) c. Analyze the residuals from this experiment. Are there any problems with model adequacy? Lead Recv ST RC pH -1 39.8 -1 51.3 -1 -1 -1 -1 57.9 78.9 -1 78.9 -1 -1 1. 84.2 -1 1. -1 94.4 94.7 42.1 -1 -1 -1 -1 -1 48 -1 -1 58.1 -1 85.9 -1 -1 84.2 -1 1. 84.2 -1 90.9 105.3 1.
Step by Step Solution
3.44 Rating (167 Votes )
There are 3 Steps involved in it
Step: 1

Get Instant Access to Expert-Tailored Solutions
See step-by-step solutions with expert insights and AI powered tools for academic success
Step: 2

Step: 3

Ace Your Homework with AI
Get the answers you need in no time with our AI-driven, step-by-step assistance
Get StartedRecommended Textbook for
Statistics For Engineers And Scientists
Authors: William Navidi
3rd Edition
73376345, 978-0077417581, 77417585, 73376337, 978-0073376332
Students also viewed these Mathematics questions
Question
Answered: 1 week ago
Question
Answered: 1 week ago
Question
Answered: 1 week ago
Question
Answered: 1 week ago
Question
Answered: 1 week ago
Question
Answered: 1 week ago
Question
Answered: 1 week ago
Question
Answered: 1 week ago
Question
Answered: 1 week ago
Question
Answered: 1 week ago
Question
Answered: 1 week ago
Question
Answered: 1 week ago
Question
Answered: 1 week ago
Question
Answered: 1 week ago
Question
Answered: 1 week ago
Question
Answered: 1 week ago
Question
Answered: 1 week ago
Question
Answered: 1 week ago
Question
Answered: 1 week ago
View Answer in SolutionInn App


