Question
An auctioneer of antique and semiantique Persian rugs kept record of his weekly auctions in order to determine the relationships among price (in British pounds,
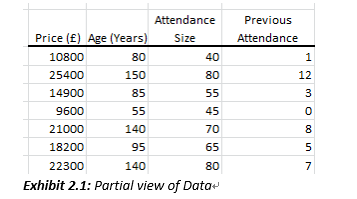
An auctioneer of antique and semiantique Persian rugs kept record of his weekly auctions in order to determine the relationships among price (in British pounds, ), age of rug (in years), number of people attending the auction (variable Attendance Size) and the number of times the winning bidder had previously attended his auction (variable Previous Attendance). He felt that with this information he could plan his auctions better, serve his steady customers better and make a higher profit overall. A partial view of the data (Exhibit 2.1) is provided below.
(a)Obtain scatter plots for variable pairs (Price, Age), (Price, Size), (Price, Previous attendance) and (Size, Age), and a matrix of intercorrelations. Comment on the type, and the strength of relationship being depicted by each pair of variables. Do these relationships seem reasonable (i.e., what we expect)? Explain.
(b)On the basis of matrix of intercorrelations, which explanatory variable seems to be the best variable in explaining variation in the response variable 'Price' if used as a single variable in a regression model? Explain your logic without fitting any models.
(c)Now fit Model 1: How much variation in 'Price' is explained by the explanatory variables used in Model 1? Include Model 1 Excel Regression Summary output in this part.
(d) Report the equation relating 'Price' to all explanatory variables in Model 1, and interpret the coefficient of explanatory variable 'Age'.
(e)Can the auctioneer conclude at the 1% level of significance that the use of all explanatory variables in Model 1 is reasonable? Perform an appropriate test to support your answer.
(f)Now fit Model 2: Price = and compare itsperformance to Model 1. Which model is performing better? Support your answer with appropriate information. (Note: It may be useful to present information in a tabular form for comparing performance of models.) Include Model 2 Excel Regression Summary output in this part.
(g)What role is being played by variable 'Age*Size' in Model 2? Is it a reasonable variable to consider including in the model? Explain.
(h)The inclusion of variable 'Age*Size' in Model 2 has produced improved R2 and adjusted R2 values (see Model 2), but the tratio for this variable is not highly significant. Explain this anomaly.
(i)Using Model 2, obtain a 95% prediction interval estimate for the auction price of a 90 years old rug on a day when 110 people show up at the auction and the winning bidder has the experience of attending 8 of the previous auctions with the current auctioneer. Include Model 2 Excel Prediction Regression Summary output in 


Step by Step Solution
There are 3 Steps involved in it
Step: 1

Get Instant Access to Expert-Tailored Solutions
See step-by-step solutions with expert insights and AI powered tools for academic success
Step: 2

Step: 3

Ace Your Homework with AI
Get the answers you need in no time with our AI-driven, step-by-step assistance
Get Started


