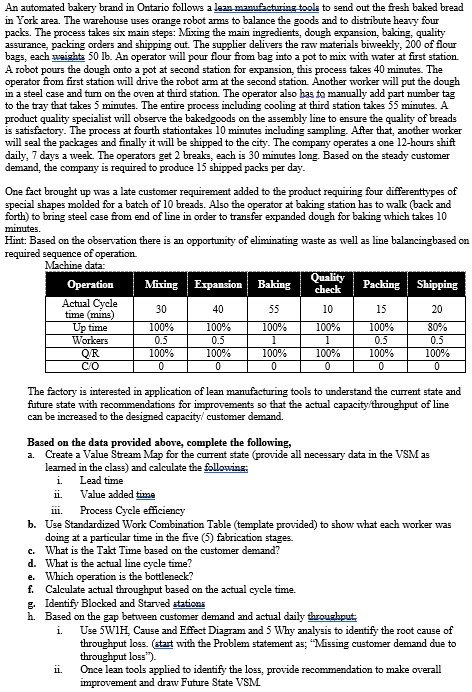
An automated bakery brand in Ontario follows a lean manufacturing tools to send out the freah baked bread in York area. The warehouse uses orange robot amms to balance the goods and to distribute heavy four packs. The process takes aix main steps: Mixing the main ingredients, dough expansion, baking, quality aosurance, packing orders and shipping out. The supplier delivers the raw materials biweekly, 200 of flour bag5, each waighte 50lb. An operator will pour flour from bag into a pot to mix with water at first atation. A robot pours the dough onto a pot at second station for expansion, this process takes 40 minutes. The operator from first station will drive the robot arm at the second atation. Another worker will put the dough in a steel case and tum on the oven at third station. The operator also has to manually add part number tag to the tray that takes 5 minutes. The entire procegs including cooling at third station takes 55 minutes. A product quality specialist will observe the bakedgoods on the assembly line to ensure the quality of breads is satisfactory. The process at fourth stationtakes 10 minutes including sampling. After that, another worker will seal the packages and finally it will be shipped to the city. The company operates a one 12-hours shift daily, 7 days a week. The operators get 2 breaks, each is 30 minutes long. Based on the steady customer demand, the company is required to produce 15 shipped packs per day. One fact brought up was a late customer requirement added to the product requiring four differenttypes of special shapes molded for a batch of 10 breads. Also the operator at baking station has to walk (back and forth) to bring steel case from end of line in order to transfer expanded dough for baking which takes 10 minutes. Hint: Based on the observation there is an opportunity of eliminating waste as well as line balancingbased on required sequence of operation. Machine data- The factory is intereated in application of lean manufacturing tools to understand the current state and future state with recommendations for improvements so that the actual capacitythroughput of line can be increased to the deaigned capacityl customer demand. Based on the data provided above, complete the following, a. Create a Value Stream Map for the current state (provide all necesgary data in the VSM as learned in the class) and calculate the following: i. Lead time ii. Value added time iii. Process Cycle efficiency b. Use Standardized Work Combination Table (template provided) to show what each worker was doing at a particular time in the five (5) fabrication stages. c. What is the Takt Time based on the customer demand? d. What is the actual line cycle time? e. Which operation is the bottleneck? f. Calculate actual throughput based on the actual cycle time. g. Identify Blocked and Starved atations h. Based on the gap between customer demand and actual daily throughput i. Use 5WlH, Cause and Effect Diagram and 5 Why analysis to identify the root cause of throughput loss. (atat with the Problem statement as; "Missing customer demand due to throughput los537 ). ii. Once lean tools applied to identify the loss, provide recommendation to make overall improvement and draw Future State VSM An automated bakery brand in Ontario follows a lean manufacturing tools to send out the freah baked bread in York area. The warehouse uses orange robot amms to balance the goods and to distribute heavy four packs. The process takes aix main steps: Mixing the main ingredients, dough expansion, baking, quality aosurance, packing orders and shipping out. The supplier delivers the raw materials biweekly, 200 of flour bag5, each waighte 50lb. An operator will pour flour from bag into a pot to mix with water at first atation. A robot pours the dough onto a pot at second station for expansion, this process takes 40 minutes. The operator from first station will drive the robot arm at the second atation. Another worker will put the dough in a steel case and tum on the oven at third station. The operator also has to manually add part number tag to the tray that takes 5 minutes. The entire procegs including cooling at third station takes 55 minutes. A product quality specialist will observe the bakedgoods on the assembly line to ensure the quality of breads is satisfactory. The process at fourth stationtakes 10 minutes including sampling. After that, another worker will seal the packages and finally it will be shipped to the city. The company operates a one 12-hours shift daily, 7 days a week. The operators get 2 breaks, each is 30 minutes long. Based on the steady customer demand, the company is required to produce 15 shipped packs per day. One fact brought up was a late customer requirement added to the product requiring four differenttypes of special shapes molded for a batch of 10 breads. Also the operator at baking station has to walk (back and forth) to bring steel case from end of line in order to transfer expanded dough for baking which takes 10 minutes. Hint: Based on the observation there is an opportunity of eliminating waste as well as line balancingbased on required sequence of operation. Machine data- The factory is intereated in application of lean manufacturing tools to understand the current state and future state with recommendations for improvements so that the actual capacitythroughput of line can be increased to the deaigned capacityl customer demand. Based on the data provided above, complete the following, a. Create a Value Stream Map for the current state (provide all necesgary data in the VSM as learned in the class) and calculate the following: i. Lead time ii. Value added time iii. Process Cycle efficiency b. Use Standardized Work Combination Table (template provided) to show what each worker was doing at a particular time in the five (5) fabrication stages. c. What is the Takt Time based on the customer demand? d. What is the actual line cycle time? e. Which operation is the bottleneck? f. Calculate actual throughput based on the actual cycle time. g. Identify Blocked and Starved atations h. Based on the gap between customer demand and actual daily throughput i. Use 5WlH, Cause and Effect Diagram and 5 Why analysis to identify the root cause of throughput loss. (atat with the Problem statement as; "Missing customer demand due to throughput los537 ). ii. Once lean tools applied to identify the loss, provide recommendation to make overall improvement and draw Future State VSM


