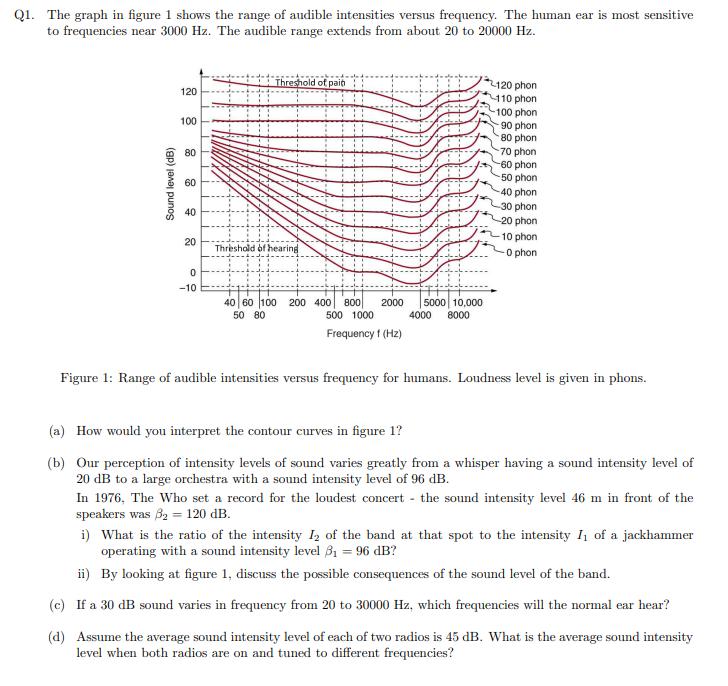
Q1. The graph in figure 1 shows the range of audible intensities versus frequency. The human ear is most sensitive to frequencies near 3000

Q1. The graph in figure 1 shows the range of audible intensities versus frequency. The human ear is most sensitive to frequencies near 3000 Hz. The audible range extends from about 20 to 20000 Hz. Sound level (dB) 120 100 80 60 40 20 0 -10 Threshold of pain Threshold of hearing 40 60 100 200 400 800 2000 50 80 500 1000 Frequency 1 (Hz) 5000 10,000 4000 8000 120 phon 110 phon 100 phon 90 phon 80 phon -70 phon -60 phon -50 phon -40 phon -30 phon -20 phon 10 phon -0 phon Figure 1: Range of audible intensities versus frequency for humans. Loudness level is given in phons. (a) How would you interpret the contour curves in figure 1? (b) Our perception of intensity levels of sound varies greatly from a whisper having a sound intensity level of 20 dB to a large orchestra with a sound intensity level of 96 dB. In 1976, The Who set a record for the loudest concert the sound intensity level 46 m in front of the speakers was 3= 120 dB. i) What is the ratio of the intensity I2 of the band at that spot to the intensity I of a jackhammer operating with a sound intensity level 3 = 96 dB? ii) By looking at figure 1, discuss the possible consequences of the sound level of the band. (c) If a 30 dB sound varies in frequency from 20 to 30000 Hz, which frequencies will the normal ear hear? (d) Assume the average sound intensity level of each of two radios is 45 dB. What is the average sound intensity level when both radios are on and tuned to different frequencies?
Step by Step Solution
3.49 Rating (172 Votes )
There are 3 Steps involved in it
Step: 1
a Answer Particularly in the low and highfrequency ranges the ear does not res...
See step-by-step solutions with expert insights and AI powered tools for academic success
Step: 2

Step: 3

Ace Your Homework with AI
Get the answers you need in no time with our AI-driven, step-by-step assistance
Get Started


