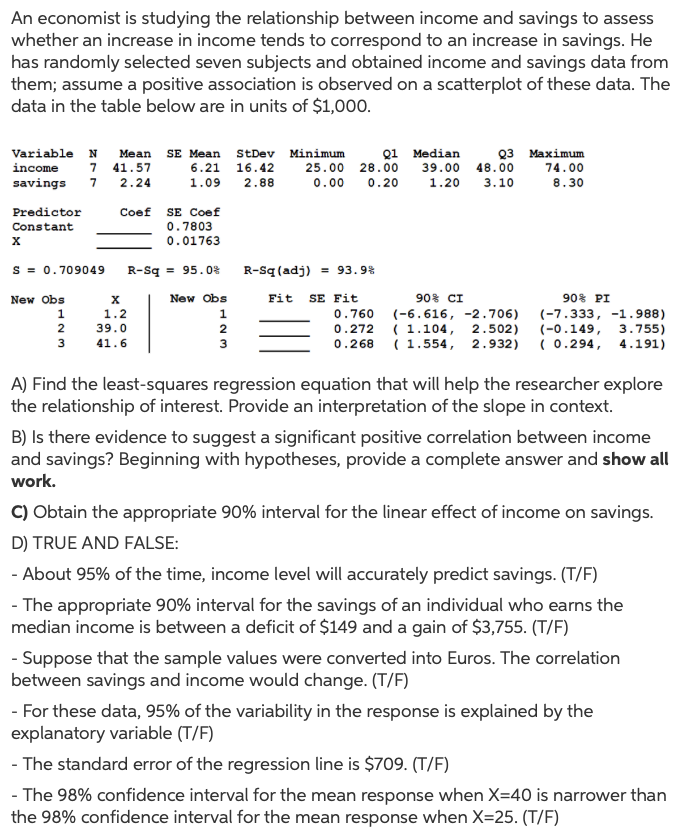
An economist is studying the relationship between income and savings to assess whether an increase in income tends to correspond to an increase in savings. He has randomly selected seven subjects and obtained income and savings data from them; assume a positive association is observed on a scatterplot of these data. The data in the table below are in units of $1,000. Variable It Mean SE Bean 5000'? Minimal 91 Indian 93 mm inccun 1' 41.51 6.21 16.42 25.00 20.00 39.00 48.00 14.00 savings 1 2.24 1.00 2.00 0.00 0.20 1.20 3.10 8.30 Predictor Coaf BECoaiE Constant. 0.7003 3 0.01763 S = 0.709049 R-Sq = 95.0% R-Sqtldj} = 93.9% new 0m x New Obs tit 5:: r11: 90% c1 90% PI 1 1.2 1 0.160 (-6.616, -2.706) (-7.333, -1.988) 2 39.0 2 0.212 (1.104, 2.502) (-0.149, 3.155} 3 41.5 3 0.260 r 1.554, 2.932} r 0.294, 4.191) A] Find the least-squares regression equation that will help the researcher explore the relationship of interest. Provide an interpretation of the slope in context. B) Is there evidence to suggest a significant positive correlation between income and savings? Beginning with hypotheses, provide a complete answer and show all work. C} Obtain the appropriate 90% interval for the linear effect of income on savings. D) TRUE AND FALSE: - About 95% of the time, income level will accurately predict savings. (T! F) - The appropriate 90% interval for the savings of an individual who earns the median income is between a deficit of $149 and a gain of $3.755. (T! F) - Suppose that the sample values were converted into Euros. The correlation between savings and income would change. (TIP) - For these data. 95% of the variability in the response is explained by the explanatory variable (T f F) - The standard error of the regression line is $709. (TIF) - The 98% confidence interval for the mean response when X=40 is narrower than the 98% confidence interval for the mean response when X=25. (TlF)