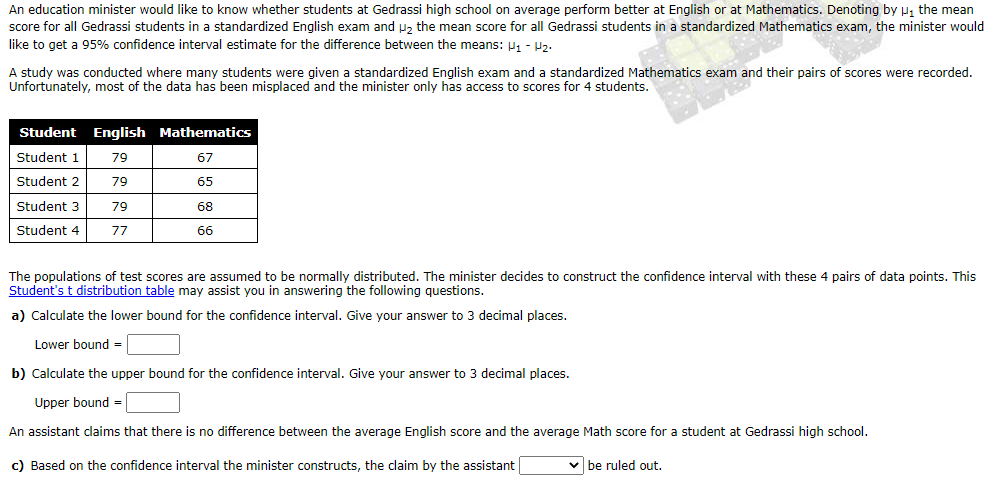
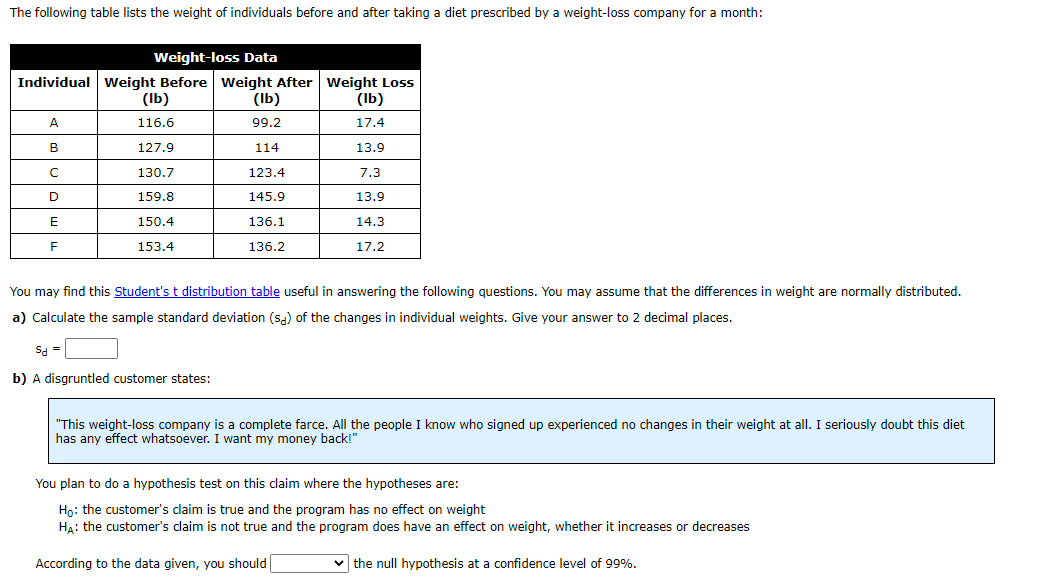
An education minister would like to know whether students at Gedrassi high school on average perform better at English or at Mathematics. Denoting by , the mean score for all Gedrassi students in a standardized English exam and uz the mean score for all Gedrassi students in a standardized Mathematics exam, the minister would like to get a 95% confidence interval estimate for the difference between the means: H1 - 2. A study was conducted where many students were given a standardized English exam and a standardized Mathematics exam and their pairs of scores were recorded. Unfortunately, most of the data has been misplaced and the minister only has access to scores for 4 students. Student English Mathematics Student 1 79 67 Student 2 79 65 Student 3 79 68 Student 4 77 66 The populations of test scores are assumed to be normally distributed. The minister decides to construct the confidence interval with these 4 pairs of data points. This Student's t distribution table may assist you in answering the following questions. a) Calculate the lower bound for the confidence interval. Give your answer to 3 decimal places. Lower bound = b) Calculate the upper bound for the confidence interval. Give your answer to 3 decimal places. Upper bound = An assistant claims that there is no difference between the average English score and the average Math score for a student at Gedrassi high school. c) Based on the confidence interval the minister constructs, the claim by the assistant be ruled out.The following table lists the weight of individuals before and after taking a diet prescribed by a weightloss company for a monih: Weightloss Data Individual Weight Before Weight After Weight Loss (lb) (lb) (lb) A 116.6 99.2 17.4 B 12?.9 114 13.9 C 130.?r 123.4 7.3 D 159.8 145.9 13.9 E 150.4 136.1 14.3 F 153.4 136.2 1?.2 You may nd this Student's t distribution table useful in answering the following questions. You may assume that the differences in weight are normally distributed. a) Calculate the sample standard deviation (sd) of the changes in individual weights. Give your answer to 2 decimal places. IJ) A disgruntled customer states: \"This weightloss company is a complete farce. All the people 1 knowI who signed up experienced no changes in their weight at all. I seriously doubt this diet has any effect whatsoever. I want my money back!" You plan to do a hypothesis test on this claim where the hypotheses are: Ho: the customer's claim is true and the program has no effect on weight HA: the customer's claim is not true and the program does have an effect on weight, whether it increases or decreases According to the data given, you should the null hypothesis at a condence level of 99%