Answered step by step
Verified Expert Solution
Link Copied!

Question

1 Approved Answer

An educational researcher randomly assigned 22-fourth-grade students to four groups in order to compare the effectiveness of four teaching methods (designated as Methods 1,2,3 and

An educational researcher randomly assigned 22-fourth-grade students to four groups in order to compare the effectiveness of four teaching methods (designated as Methods 1,2,3 and 4), all taught by the same teacher. At the end of the semester, the same test was given to all students. SPSS output of the results is shown below. At the 5% significance level, on e-way ANOVOA (see table below) determined that there is a difference in the effectiveness of the four teaching methods, that is, at least two means are different.
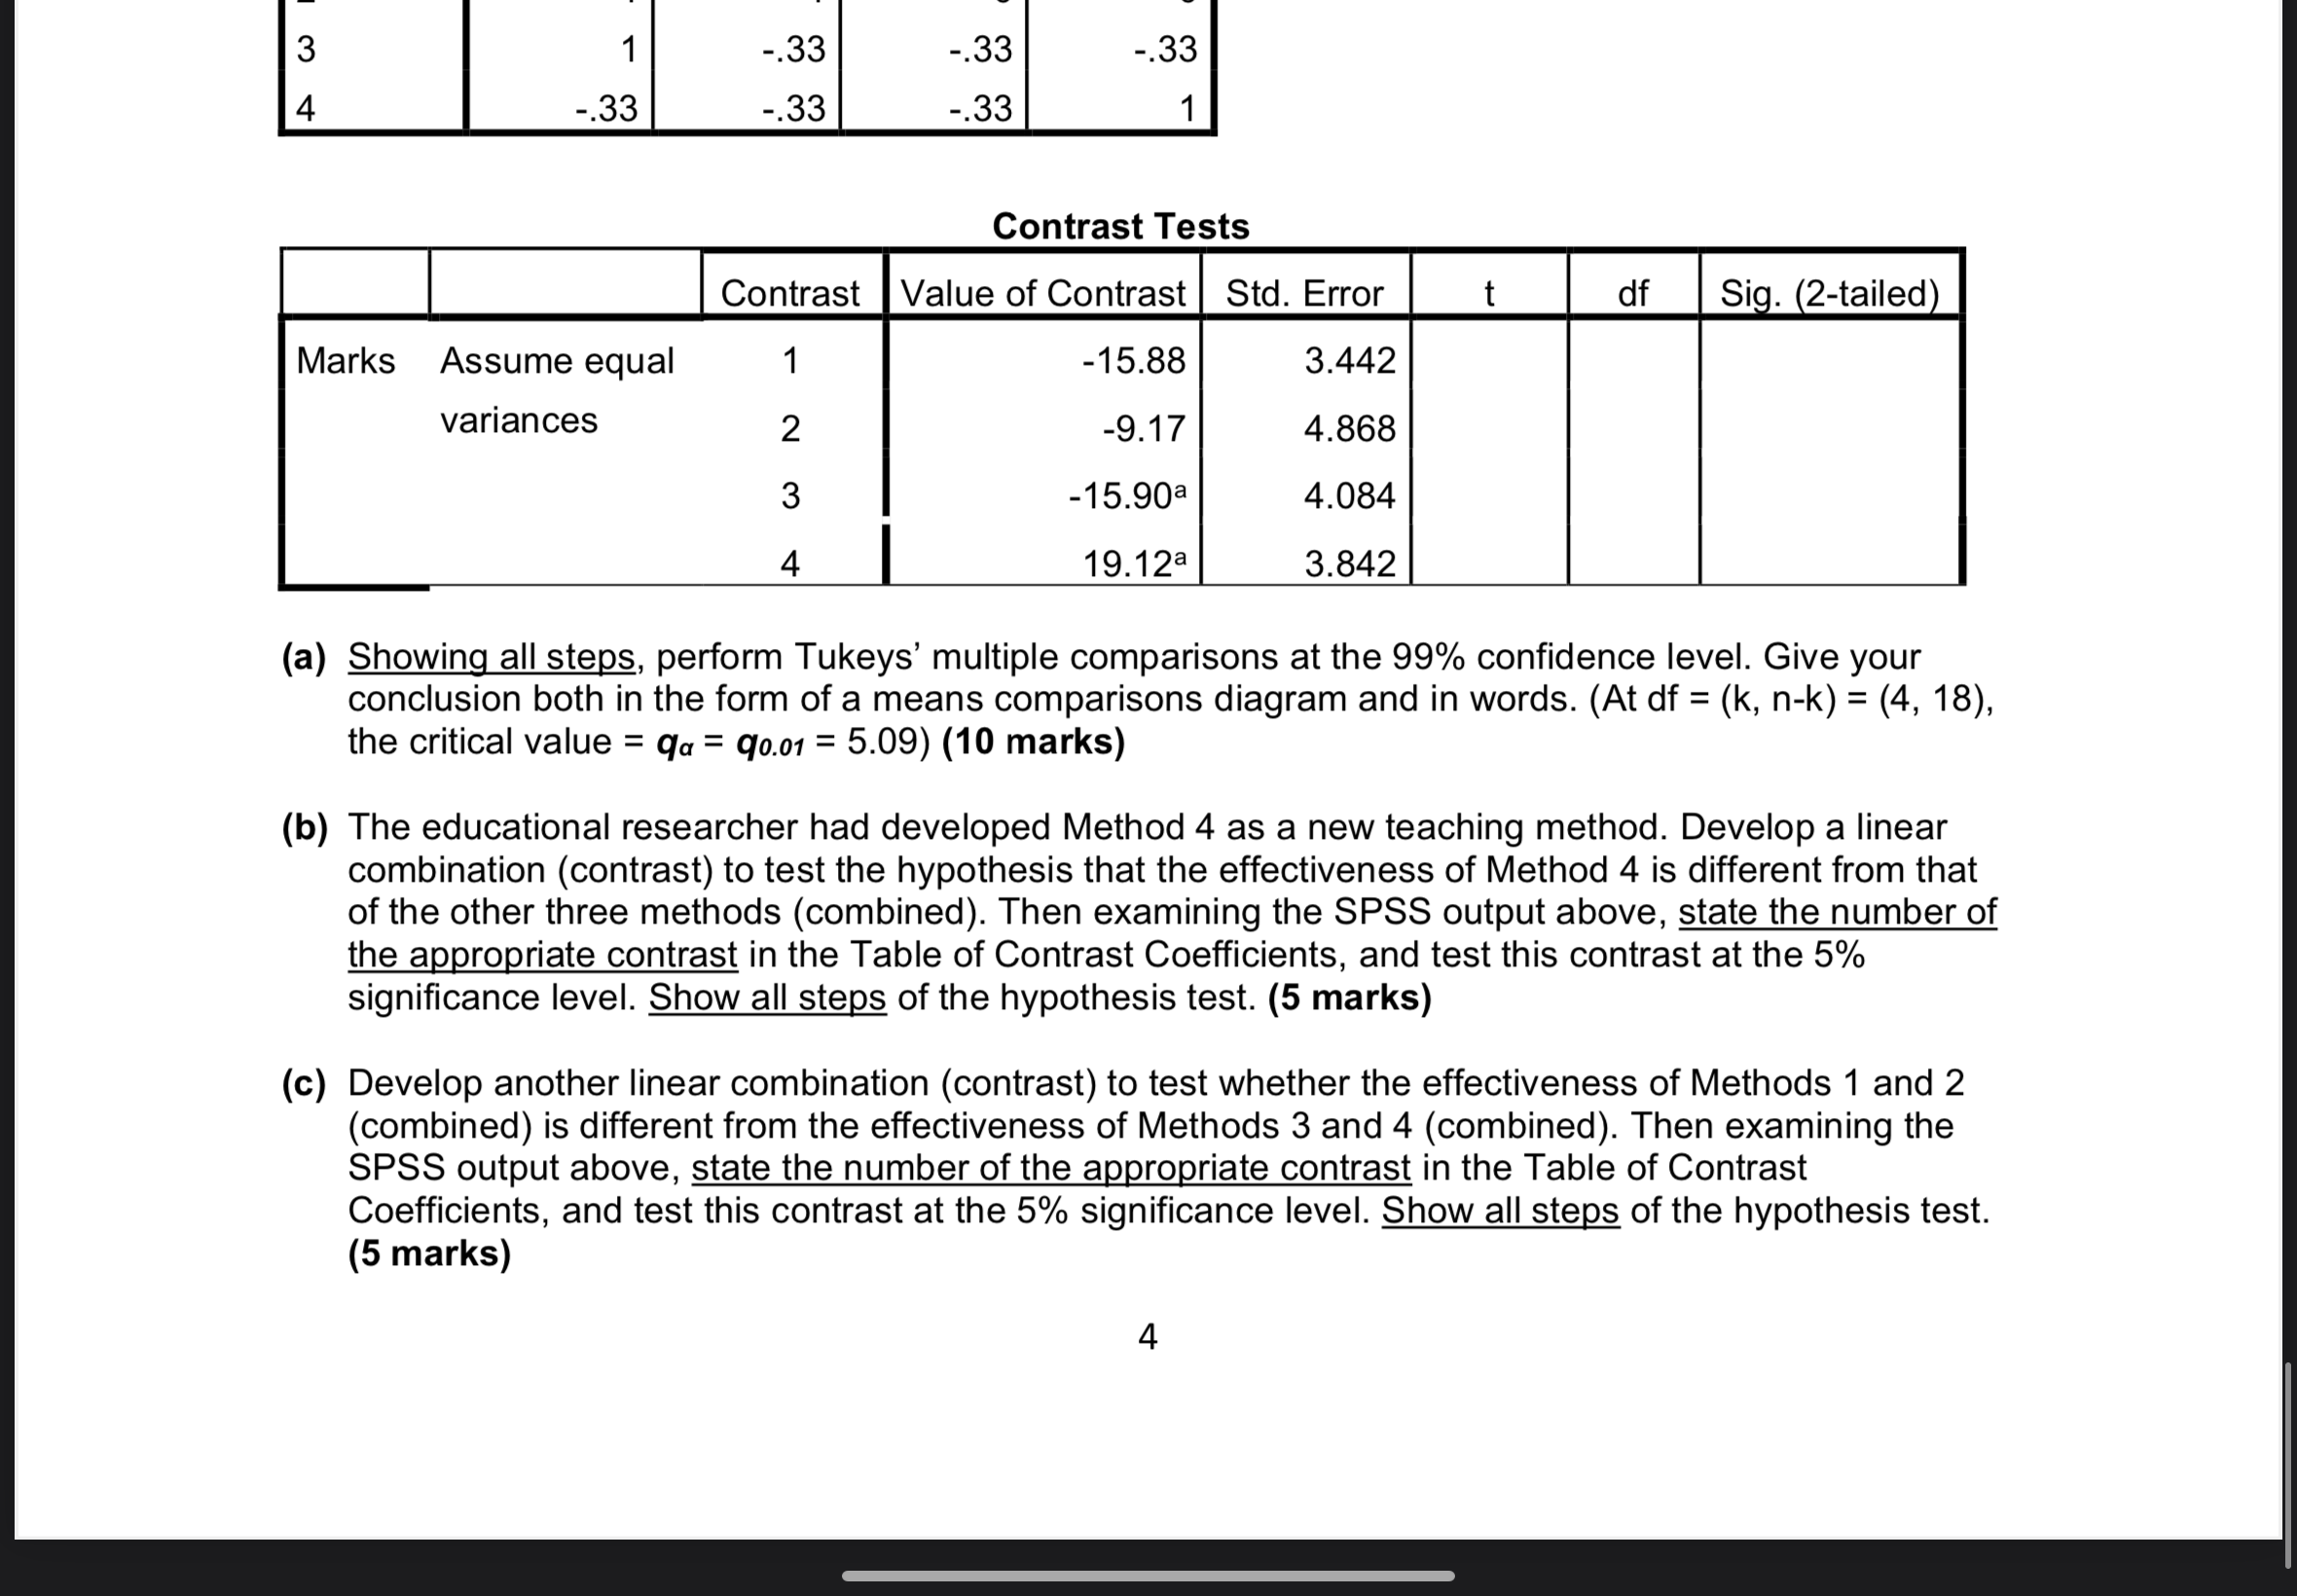
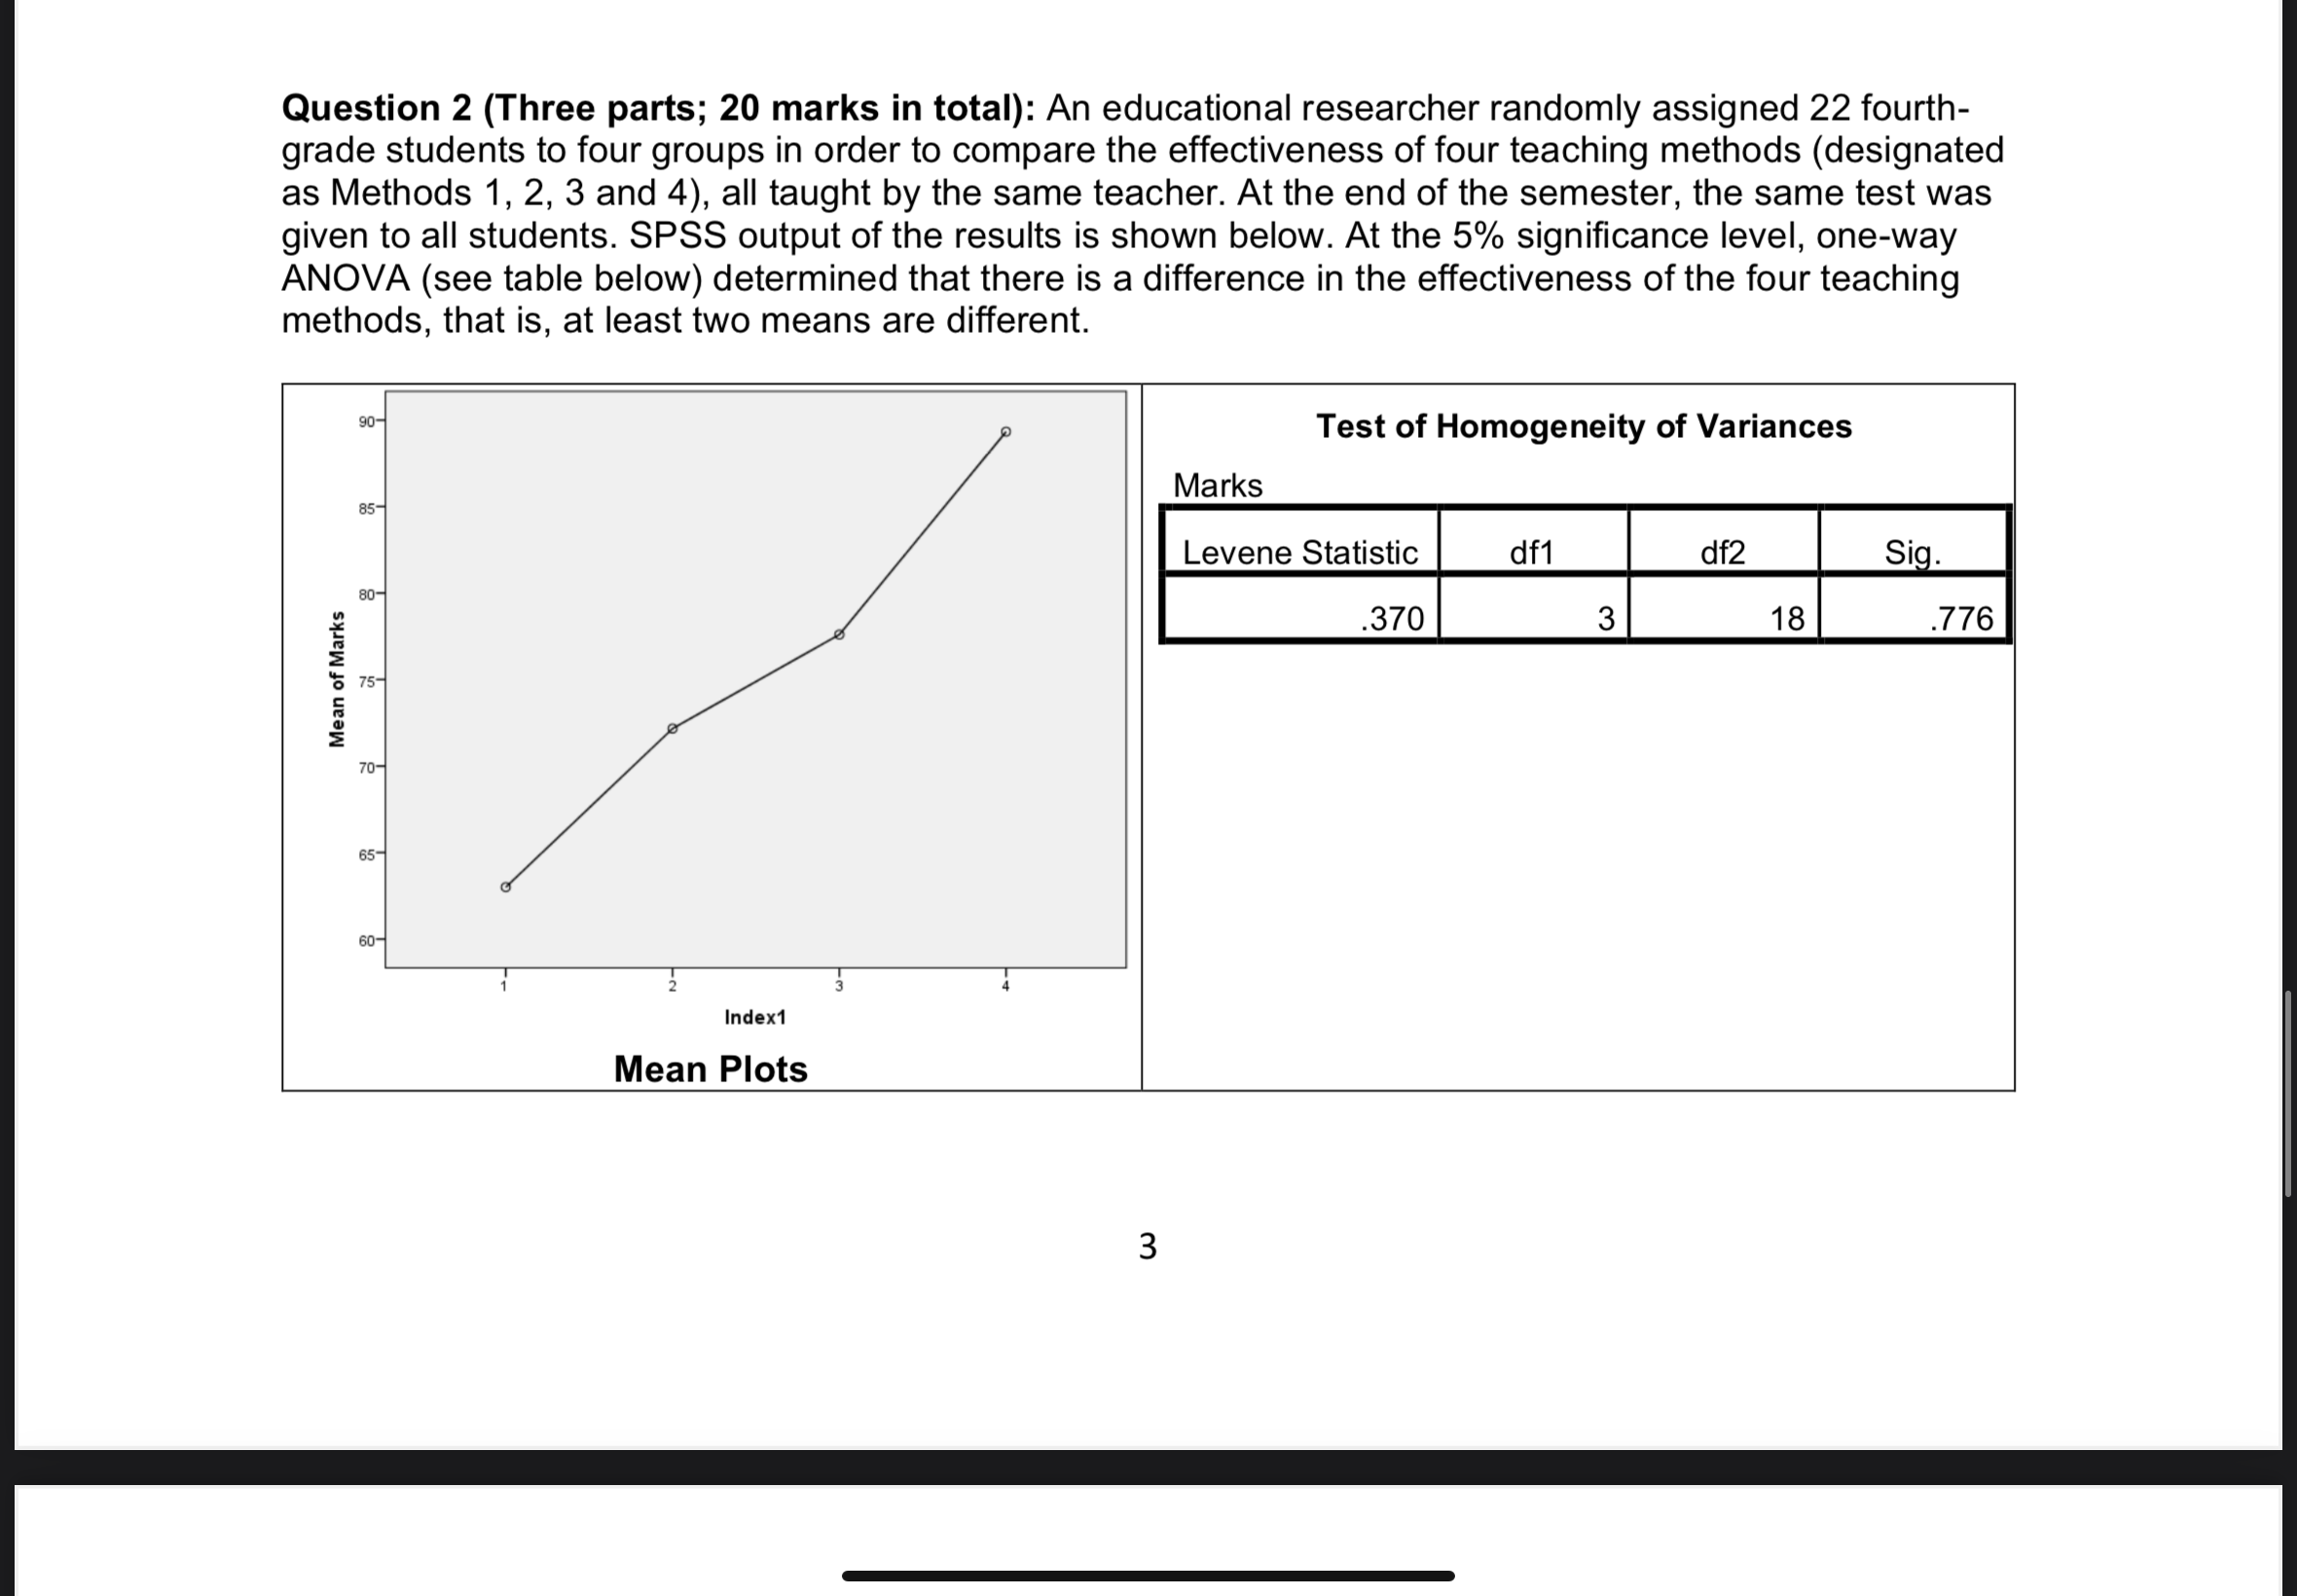
image text in transcribedimage text in transcribedimage text in transcribed
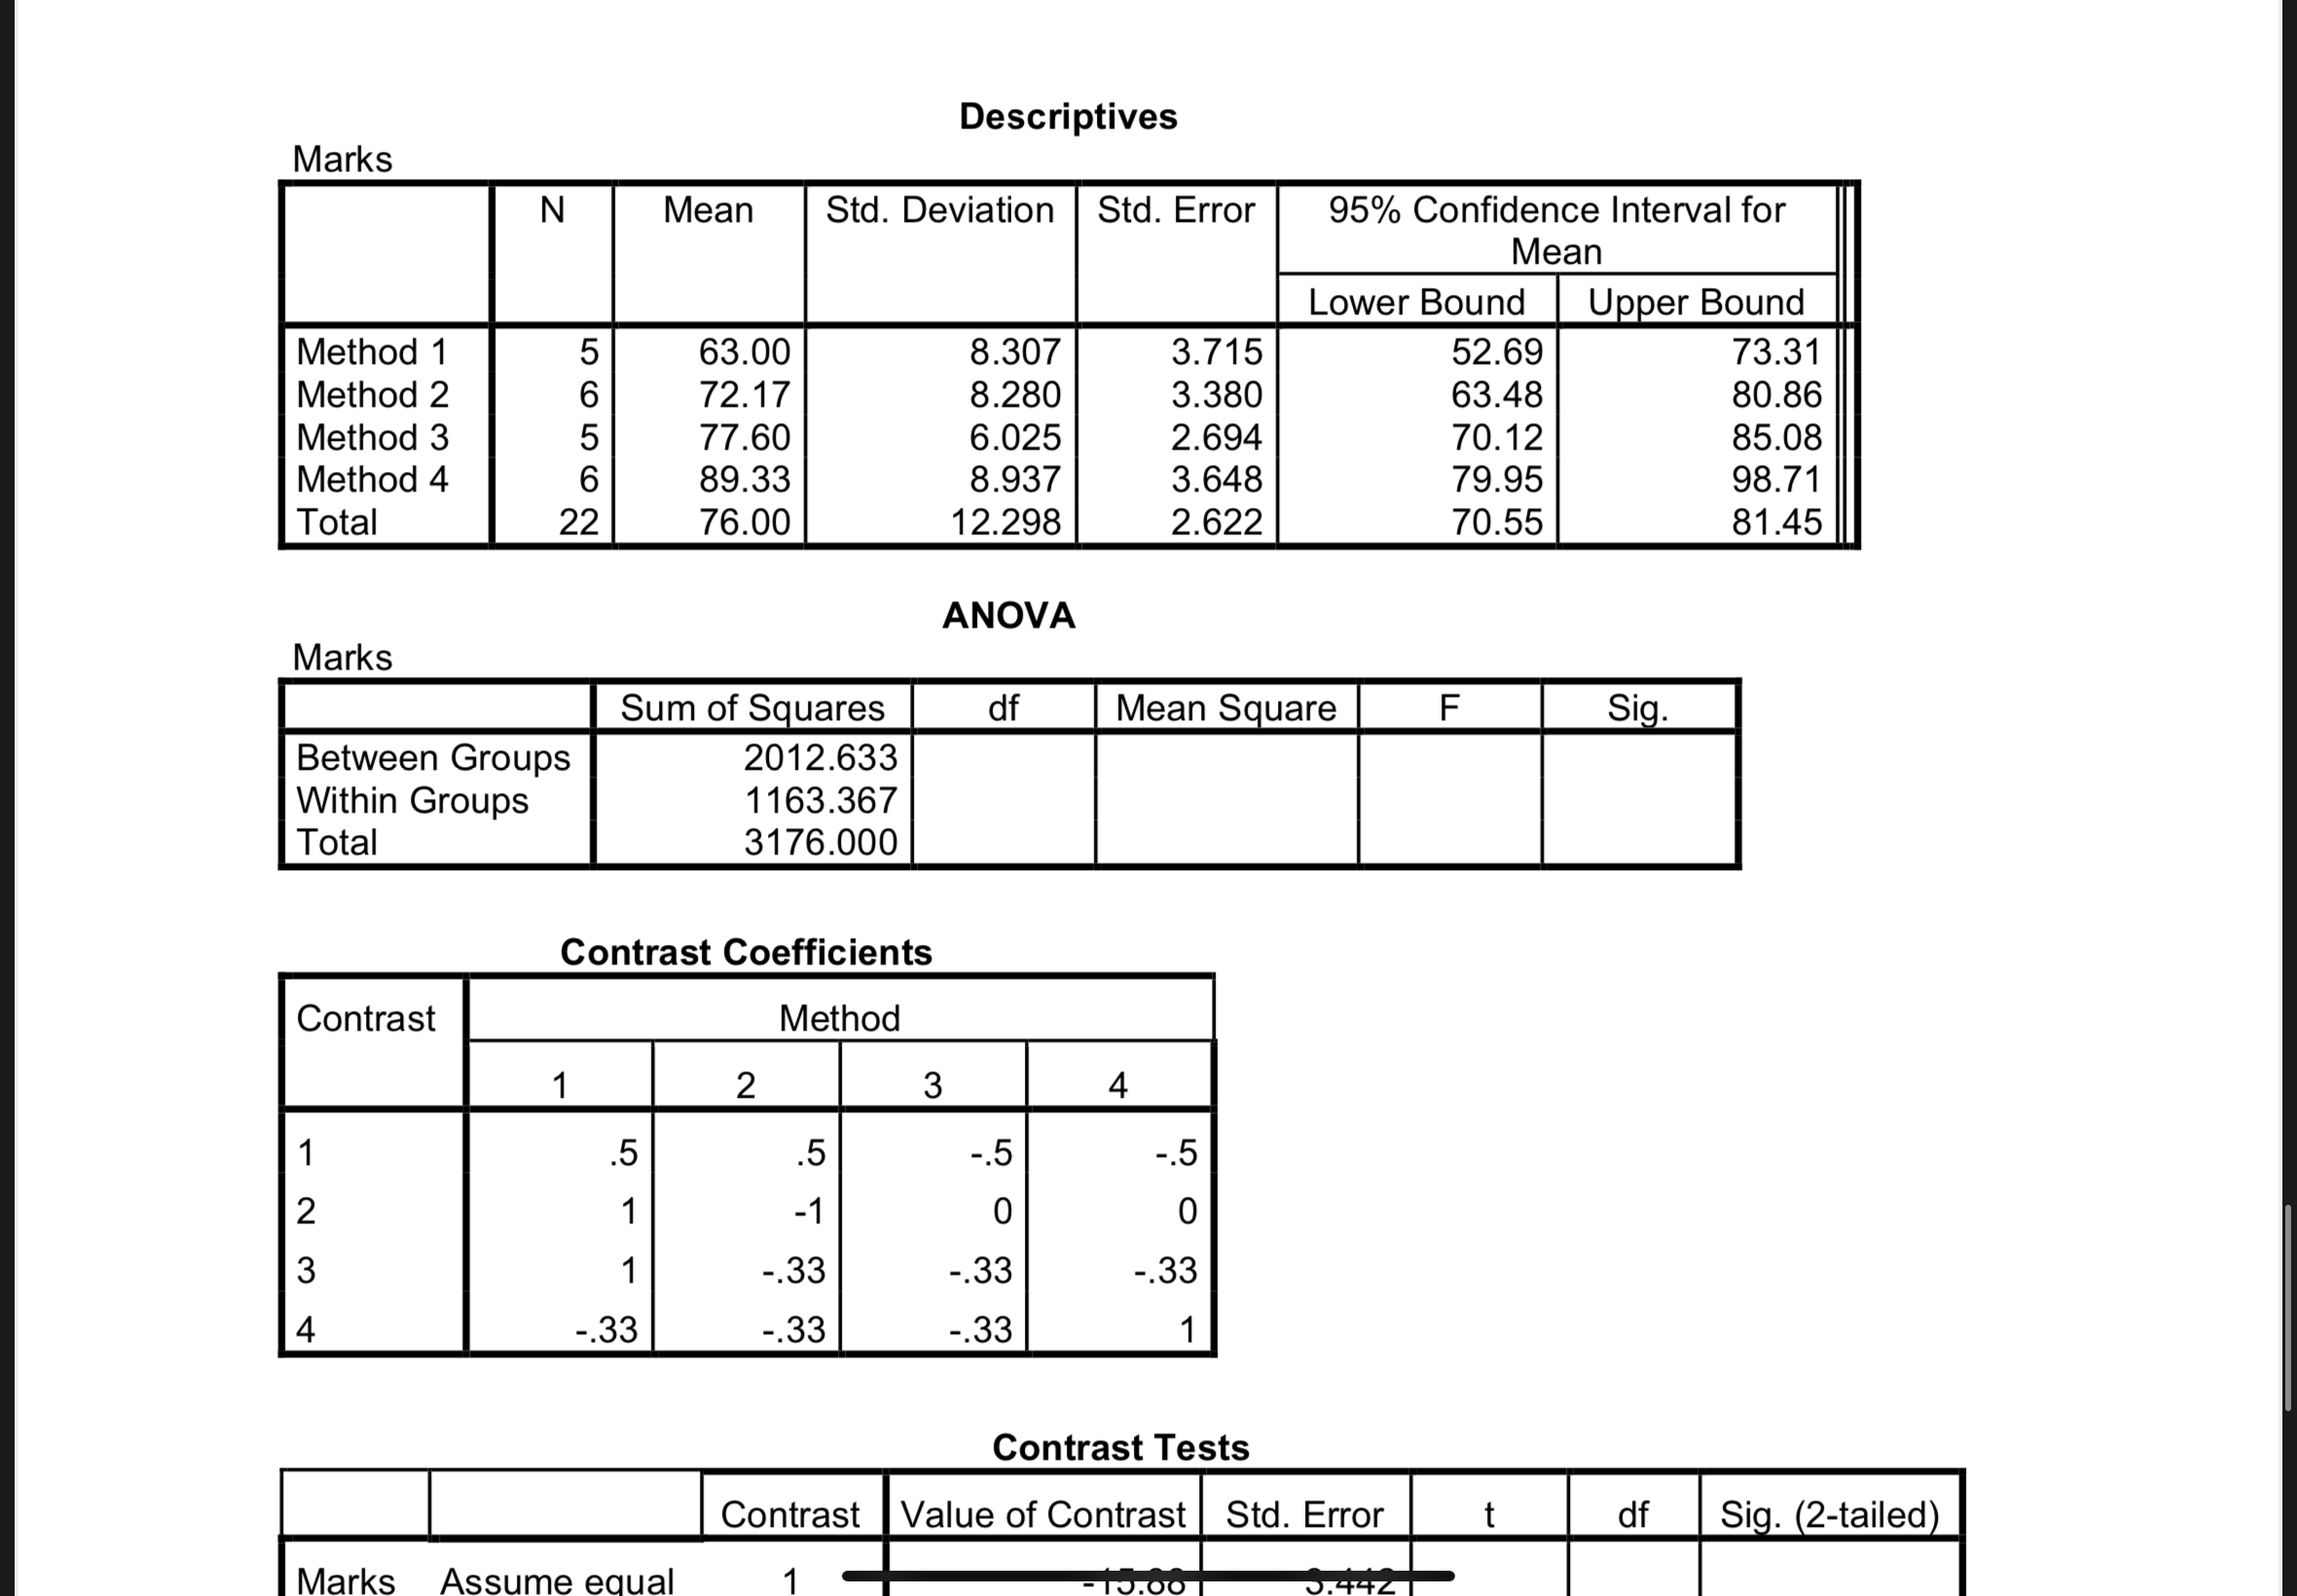
Contrast Tests -_-_-- Marks Assume equal variances (a) Showing all steps, perform Tukeys' multiple comparisons at the 99% confidence level. Give your conclusion both in the form of a means comparisons diagram and in words. (At df = (k, n-k) = (4, 18), the critical value = qa = qo.o1 = 5.09) (10 marks) (b) The educational researcher had developed Method 4 as a new teaching method. Develop a linear combination (contrast) to test the hypothesis that the effectiveness of Method 4 is different from that of the other three methods (combined). Then examining the SPSS output above, state the number of the appropriate contrast in the Table of Contrast Coefficients, and test this contrast at the 5% signicance level. Show all steps of the hypothesis test. (5 marks) (c) Develop another linear combination (contrast) to test whether the effectiveness of Methods 1 and 2 (combined) is different from the effectiveness of Methods 3 and 4 (combined). Then examining the SPSS output above, state the number of the appropriate contrast in the Table of Contrast Coefficients, and test this contrast at the 5% significance level. Show all steps of the hypothesis test. (5 marks) Question 2 (Three parts; 20 marks in total): An educational researcher randomly assigned 22 fourth- grade students to four groups in order to compare the effectiveness of four teaching methods (designated as Methods 1, 2, 3 and 4), all taught by the same teacher. At the end of the semester, the same test was given to all students. SPSS output of the results is shown below. At the 5% signicance level, one-way ANOVA (see table below) determined that there is a difference in the effectiveness of the four teaching methods, that is, at least two means are different. 9\"\" Test of Homogeneity of Variances Marks 55. ' 75' Mean of Marks 70- | I I 2 3 4 Index1 Mean Plots Descriptives Marks N Mean Std. Deviation Std. Error 95% Confidence Interval for Mean Lower Bound Upper Bound Method 1 63.00 8.307 3.715 52.69 73.31 Method 2 72.17 8.280 3.380 63.48 80.86 Method 3 77.60 6.025 2.694 70.12 85.08 Method 4 89.33 8.937 3.648 79.95 98.71 Total 22 76.00 12.298 2.622 70.55 81.45 ANOVA Marks Sum of Squares df Mean Square F Sig. Between Groups 2012.633 Within Groups 1163.367 Total 3176.000 Contrast Coefficients Contrast Method 1 2 3 4 .5 .5 -.5 .5 -1 0 0 W N -.33 -.33 -.33 -A -.33 -.33 -.33 Contrast Tests Contrast Value of Contrast Std. Error t df Sig. (2-tailed) Marks Assume equal
Step by Step Solution

There are 3 Steps involved in it

Step: 1

blur-text-image

Get Instant Access to Expert-Tailored Solutions

See step-by-step solutions with expert insights and AI powered tools for academic success

Step: 2

blur-text-image

Step: 3

blur-text-image

Ace Your Homework with AI

Get the answers you need in no time with our AI-driven, step-by-step assistance

Get Started

Recommended Textbook for

An Introduction to the Mathematics of financial Derivatives

Authors: Salih N. Neftci

2nd Edition

978-0125153928, 9780080478647, 125153929, 978-0123846822

More Books

Students also viewed these Mathematics questions