

Question
An emergency department has a goal to ensure that all patients who need an X-ray receive one within an hour of arrival. The data in
An emergency department has a goal to ensure that all patients who need an X-ray receive one within an hour of arrival. The data in the sheet named ED Compliance has the percent of cases each month that met the goal over a period of two years. The staff implemented revised protocols in months 13 and 19.
using visual inspection of the histogram above, describe the compliance rate during the study period. Describe the shape of the histogram 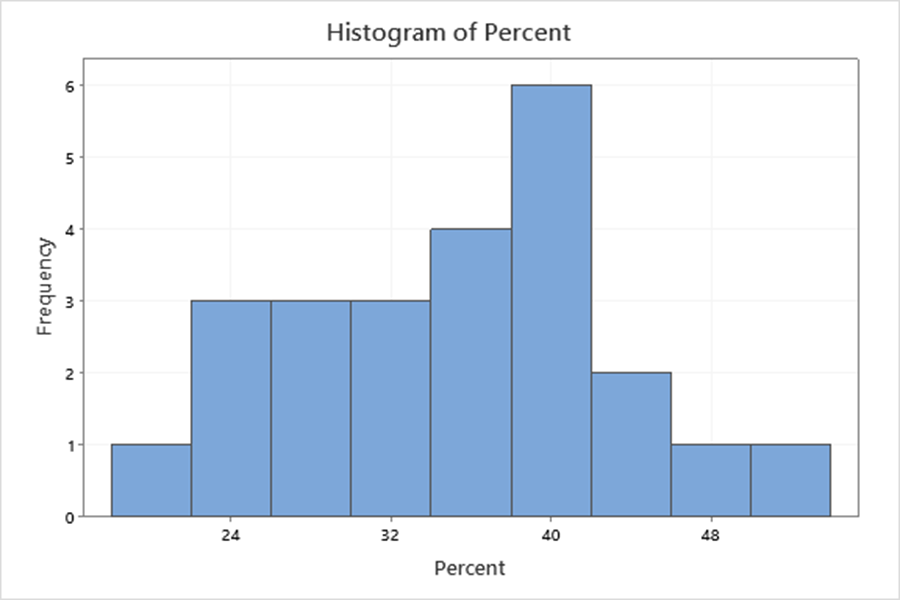
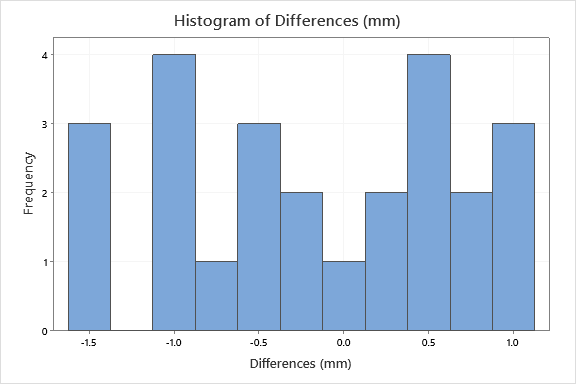
A manufacturer produces a machined part with a target length of 200 mm. After completing maintenance on the production equipment, the staff collect measurements on the differences between samples of machined parts and the target value
By visual inspection, do the sample differences appear centered around 0? Comment on the shape of the histogram.
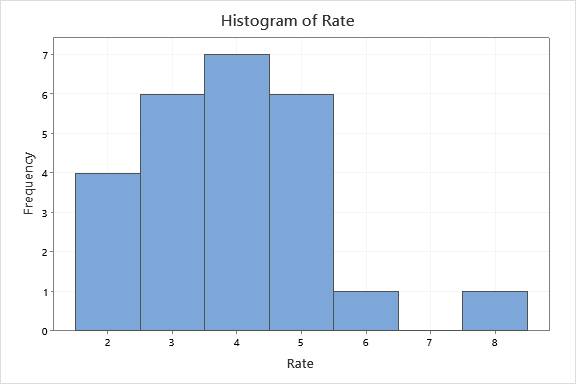
A regional airline company wants to reduce the number of checked bags that do not arrive at the passengers final destination on the same flight. As a first step in planning an improvement project, the improvement team collects data from a major hub over the course of 26 days. They track the count of late bags for each of two shifts per day. Since the number of checked bags per shift can vary, they report the rate as the number of late bags per 1,000 checked bags
using visual inspection of the histogram, describe a typical rate during the study period. Comment on the shape of the histogram.
Histogram of Percent 6 5 Frequency L 2 1 0 24 32 40 48 Percent Histogram of Differences (mm) 4 3 Frequency 1 0 -1.5 -1.0 0.0 0.5 1.0 -0.5 Differences (mm) Histogram of Rate 7 in 5 Frequency 3 2 1 0 2 3 4 5 6 7 8 Rate Histogram of Percent 6 5 Frequency L 2 1 0 24 32 40 48 Percent Histogram of Differences (mm) 4 3 Frequency 1 0 -1.5 -1.0 0.0 0.5 1.0 -0.5 Differences (mm) Histogram of Rate 7 in 5 Frequency 3 2 1 0 2 3 4 5 6 7 8 Rate
Step by Step Solution
There are 3 Steps involved in it
Step: 1

Get Instant Access to Expert-Tailored Solutions
See step-by-step solutions with expert insights and AI powered tools for academic success
Step: 2

Step: 3
Ace Your Homework with AI
Get the answers you need in no time with our AI-driven, step-by-step assistance
Get Started
Wealth Mastery Unveiled By Marcus M Dawson A Millennial S Guide To Financial Freedom And Success
Authors: Marcus M. Dawson
1st Edition
979-8865054313