Question
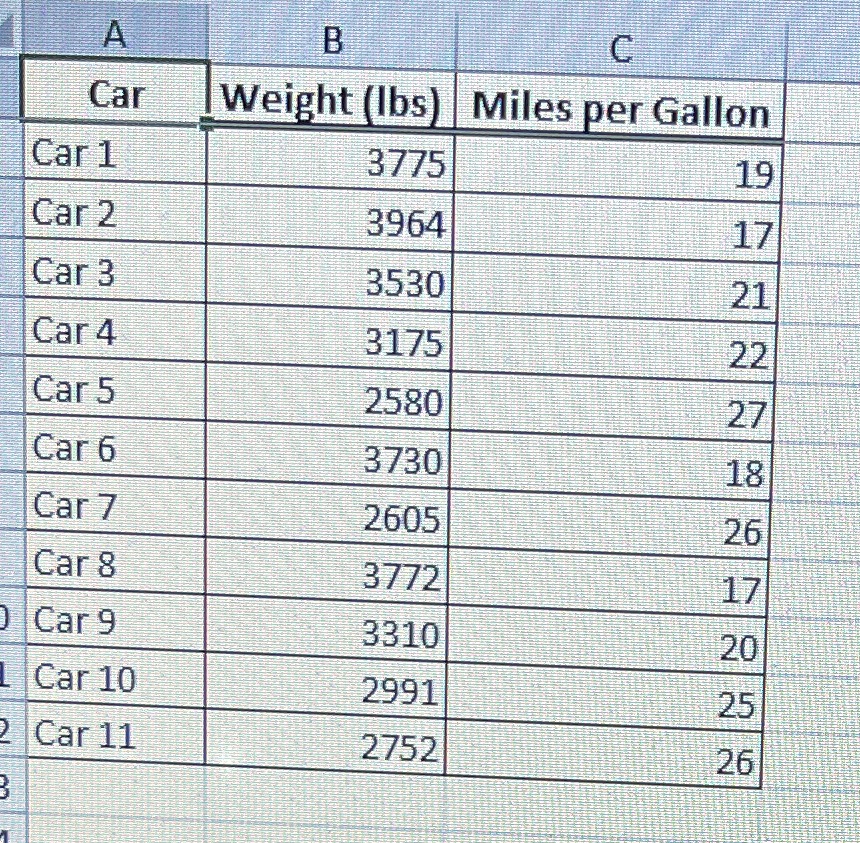
An engineer wanted to determine how the weight of a car affects gas mileage. The accompanying data represent the weights of various domestic cars and
An engineer wanted to determine how the weight of a car affects gas mileage. The accompanying data represent the weights of various domestic cars and their gas mileages in the city for a certain model year. Complete parts a through d below. a) determine which variable is less likely explanatory variable and which is the likely response variable. Choose the correct answer below.a. The explanatory variable is the weight and the response variable is the miles per gallonb. The explanatory variable is the miles per gallon and the response variable is the weightB) draw a scatter diagram of the data. C) compute the linear correlation coefficient between the weight of a car and its miles per gallon Fill in the blank for part DD) the variables weight of a car and it's miles per gallon are negatively/positively/ or not associated because r is negative/ zero/ positive and the absolute value of the correlation coefficient is greater/ less than the critical value ____ . (Round to three decimal places)

Step by Step Solution
There are 3 Steps involved in it
Step: 1

Get Instant Access to Expert-Tailored Solutions
See step-by-step solutions with expert insights and AI powered tools for academic success
Step: 2

Step: 3

Ace Your Homework with AI
Get the answers you need in no time with our AI-driven, step-by-step assistance
Get Started


