Question
An experiment is designed to measure the viscosity of an unknown liquid as a function of temperature. The flow time, 1, of a specific

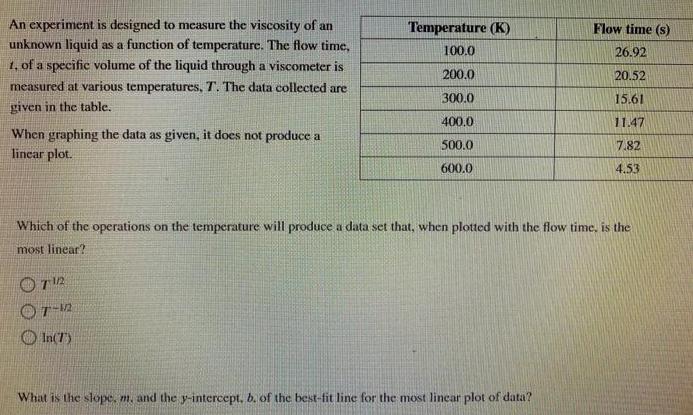
An experiment is designed to measure the viscosity of an unknown liquid as a function of temperature. The flow time, 1, of a specific volume of the liquid through a viscometer is Temperature (K) Flow time (s) 100.0 26.92 200.0 20.52 measured at various temperatures, T. The data collected are 300.0 15.61 given in the table. 400.0 11.47 When graphing the data as given, it does not produce a 500.0 7.82 lincar plot. 600.0 4.53 Which of the operations on the temperature will produce a data set that, when plotted with the flow time, is the most linear? OT O In(7) What is the sope, m, and the y-intercept, b. of the best-fit line for the most lincar plot of data?
Step by Step Solution
3.49 Rating (162 Votes )
There are 3 Steps involved in it
Step: 1

Get Instant Access to Expert-Tailored Solutions
See step-by-step solutions with expert insights and AI powered tools for academic success
Step: 2

Step: 3

Ace Your Homework with AI
Get the answers you need in no time with our AI-driven, step-by-step assistance
Get StartedRecommended Textbook for
Fundamentals of Heat and Mass Transfer
Authors: Incropera, Dewitt, Bergman, Lavine
6th Edition
978-0470055540, 471457280, 470881453, 470055545, 978-0470881453, 978-0471457282
Students also viewed these Chemistry questions
Question
Answered: 1 week ago
Question
Answered: 1 week ago
Question
Answered: 1 week ago
Question
Answered: 1 week ago
Question
Answered: 1 week ago
Question
Answered: 1 week ago
Question
Answered: 1 week ago
Question
Answered: 1 week ago
Question
Answered: 1 week ago
Question
Answered: 1 week ago
Question
Answered: 1 week ago
Question
Answered: 1 week ago
Question
Answered: 1 week ago
Question
Answered: 1 week ago
Question
Answered: 1 week ago
Question
Answered: 1 week ago
Question
Answered: 1 week ago
Question
Answered: 1 week ago
Question
Answered: 1 week ago
Question
Answered: 1 week ago
Question
Answered: 1 week ago
View Answer in SolutionInn App


