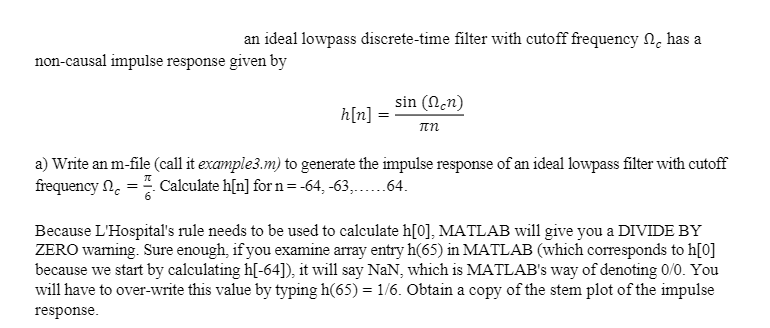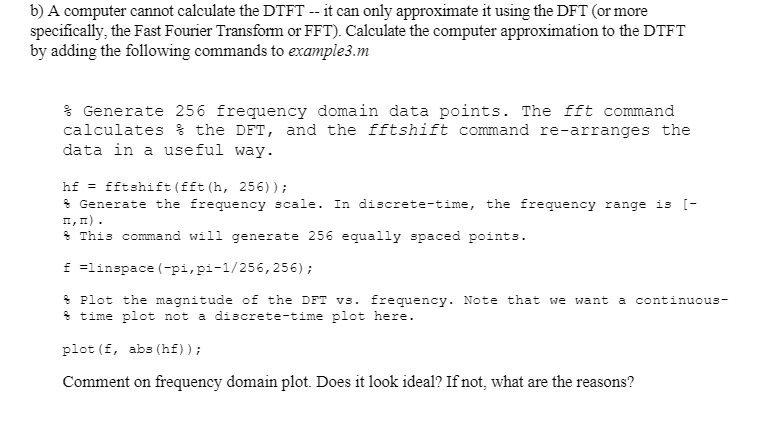


an ideal lowpass discrete-time filter with cutoff frequency Nc has a non-causal impulse response given by sin (len) h[n] = a) Write an m-file (call it example3.m) to generate the impulse response of an ideal lowpass filter with cutoff frequency No = Calculate h[n] forn=-64,-63,......64. Because L'Hospital's rule needs to be used to calculate h[0], MATLAB will give you a DIVIDE BY ZERO warning. Sure enough if you examine array entry h(65) in MATLAB (which corresponds to h[0] because we start by calculating h[-64]), it will say NaN, which is MATLAB's way of denoting 0/0. You will have to over-write this value by typing h(65) = 1/6. Obtain a copy of the stem plot of the impulse response. b) A computer cannot calculate the DTFT -- it can only approximate it using the DFT (or more specifically, the Fast Fourier Transform or FFT) Calculate the computer approximation to the DTFT by adding the following commands to example3.m Generate 256 frequency domain data points. The fft command calculates & the DFT, and the fftshift command re-arranges the data in a useful way. hf = Eftshift (ifth, 256)); # Generate the frequency scale. In discrete-time, the frequency range is [- 1,1). This command will generate 256 equally spaced points. f =linspace (-pi,pi-1/256, 256); Plot the magnitude of the DFT vs. frequency. Note that we want a continuous- time plot not a discrete-time plot here. plot (, abs (hf)); Comment on frequency domain plot. Does it look ideal? If not, what are the reasons? = c) Repeat 3a and 3b for a bandpass filter with lower and upper cutoff frequencies of 21 and 122 respectively. Once again, you will have to worry about MATLAB dividing by zero when it tries to calculate h[o]. All the MATLAB commands/operations that we looked at in this assignment (generating data, printing out plots, using the filter command, and calculating the fit of data) will be used throughout the semester an ideal lowpass discrete-time filter with cutoff frequency Nc has a non-causal impulse response given by sin (len) h[n] = a) Write an m-file (call it example3.m) to generate the impulse response of an ideal lowpass filter with cutoff frequency No = Calculate h[n] forn=-64,-63,......64. Because L'Hospital's rule needs to be used to calculate h[0], MATLAB will give you a DIVIDE BY ZERO warning. Sure enough if you examine array entry h(65) in MATLAB (which corresponds to h[0] because we start by calculating h[-64]), it will say NaN, which is MATLAB's way of denoting 0/0. You will have to over-write this value by typing h(65) = 1/6. Obtain a copy of the stem plot of the impulse response. b) A computer cannot calculate the DTFT -- it can only approximate it using the DFT (or more specifically, the Fast Fourier Transform or FFT) Calculate the computer approximation to the DTFT by adding the following commands to example3.m Generate 256 frequency domain data points. The fft command calculates & the DFT, and the fftshift command re-arranges the data in a useful way. hf = Eftshift (ifth, 256)); # Generate the frequency scale. In discrete-time, the frequency range is [- 1,1). This command will generate 256 equally spaced points. f =linspace (-pi,pi-1/256, 256); Plot the magnitude of the DFT vs. frequency. Note that we want a continuous- time plot not a discrete-time plot here. plot (, abs (hf)); Comment on frequency domain plot. Does it look ideal? If not, what are the reasons? = c) Repeat 3a and 3b for a bandpass filter with lower and upper cutoff frequencies of 21 and 122 respectively. Once again, you will have to worry about MATLAB dividing by zero when it tries to calculate h[o]. All the MATLAB commands/operations that we looked at in this assignment (generating data, printing out plots, using the filter command, and calculating the fit of data) will be used throughout the semester


