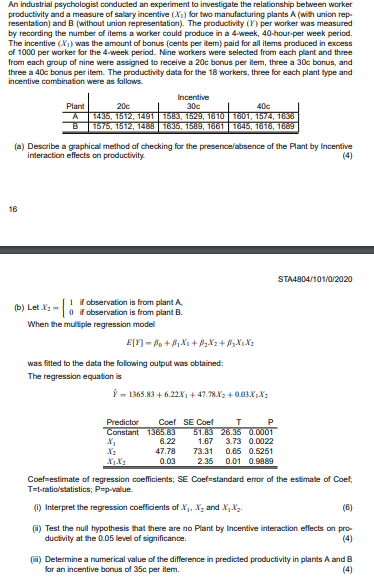
An industrial psychologist conducted an experiment to investigate the relationship between worker productivity and a measure of salary incentive (Xi) for two manufacturing plants A (with union rep- resentation) and B (without union representation). The productivity (1) per worker was measured by recording the number of items a worker could produce in a 4-week, 40-hour per week period. The incentive (X1) was the amount of bonus (cents per item) paid for all items produced in excess of 1000 per worker for the 4-week period. Nine workers were selected from each plant and three from each group of nine were assigned to receive a 20c bonus per item, three a 30c bonus, and three a 40c bonus per item. The productivity data for the 18 workers, three for each plant type and incentive combination were as follows. Incentive Plant 20c 300 400 A 1435, 1512, 14911583, 1529, 1610 1601, 1574, 16:38 B 1575, 1512, 1483 1635, 1589, 1661 1645, 1616, 1689 (a) Describe a graphical method of checking for the presence absence of the Plant by Incentive interaction effects on productivity (4) 16 STA4804/101/0/2020 1 if observation is from plant A (b) Let- -{ 0 if observation is from plant When the multiple regression model ELY) - A+BX1+B_Xz+83X1 X3 was fitted to the data the following output was obtained: The regression equation is 1 - 1365.83 +6.22X1 + 47.79.X2 +0.03.X X3 Predictor Coef SE Coef Constant 1385.63 51.83 26.35 0.0001 6.22 1.67 3.73 0.0022 47.78 73.31 0.65 0.5251 X, X3 0.03 2.35 0.01 0.9889 Coef-estimate of regression coefficients; SE Coef-standard error of the estimate of Coef; T=t-ratio statistics; Pap-value () Interpret the regression coefficients of X, X, and X, Xz. (6) 6) Test the null hypothesis that there are no Plant by Incentive interaction effects on pro- ductivity at the 0.05 level of significance. (4) m) Determine a numerical value of the difference in predicted productivity in plants A and B for an incentive bonus of 35 per item An industrial psychologist conducted an experiment to investigate the relationship between worker productivity and a measure of salary incentive (Xi) for two manufacturing plants A (with union rep- resentation) and B (without union representation). The productivity (1) per worker was measured by recording the number of items a worker could produce in a 4-week, 40-hour per week period. The incentive (X1) was the amount of bonus (cents per item) paid for all items produced in excess of 1000 per worker for the 4-week period. Nine workers were selected from each plant and three from each group of nine were assigned to receive a 20c bonus per item, three a 30c bonus, and three a 40c bonus per item. The productivity data for the 18 workers, three for each plant type and incentive combination were as follows. Incentive Plant 20c 300 400 A 1435, 1512, 14911583, 1529, 1610 1601, 1574, 16:38 B 1575, 1512, 1483 1635, 1589, 1661 1645, 1616, 1689 (a) Describe a graphical method of checking for the presence absence of the Plant by Incentive interaction effects on productivity (4) 16 STA4804/101/0/2020 1 if observation is from plant A (b) Let- -{ 0 if observation is from plant When the multiple regression model ELY) - A+BX1+B_Xz+83X1 X3 was fitted to the data the following output was obtained: The regression equation is 1 - 1365.83 +6.22X1 + 47.79.X2 +0.03.X X3 Predictor Coef SE Coef Constant 1385.63 51.83 26.35 0.0001 6.22 1.67 3.73 0.0022 47.78 73.31 0.65 0.5251 X, X3 0.03 2.35 0.01 0.9889 Coef-estimate of regression coefficients; SE Coef-standard error of the estimate of Coef; T=t-ratio statistics; Pap-value () Interpret the regression coefficients of X, X, and X, Xz. (6) 6) Test the null hypothesis that there are no Plant by Incentive interaction effects on pro- ductivity at the 0.05 level of significance. (4) m) Determine a numerical value of the difference in predicted productivity in plants A and B for an incentive bonus of 35 per item


