Answered step by step
Verified Expert Solution
Question
1 Approved Answer
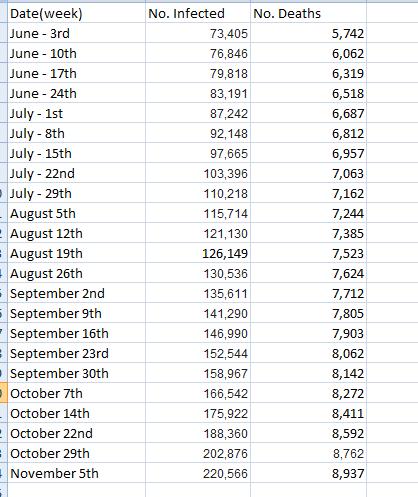
An infectious disease spreads through a large population, below is a table of the weekely number of infected people ansd number of deaths recorded 1)
An infectious disease spreads through a large population, below is a table of the weekely number of infected people ansd number of deaths recorded
1) calculate the rate monthly rate of infection
2)calculate the weekly rate of change of infected persons.
3) Graph the calculated result and explain if it a valid explanation of dI/dt.


Date(week) June - 3rd June - 10th June - 17th June - 24th July - 1st July - 8th July - 15th July - 22nd July - 29th August 5th August 12th August 19th August 26th September 2nd September 9th September 16th September 23rd September 30th October 7th October 14th October 22nd October 29th November 5th No. Infected 73,405 76,846 79,818 83,191 87,242 92,148 97,665 103,396 110,218 115,714 121,130 126,149 130,536 135,611 141,290 146,990 152,544 158,967 166,542 175,922 188,360 202,876 220,566 No. Deaths 5,742 6,062 6,319 6,518 6,687 6,812 6,957 7,063 7,162 7,244 7,385 7,523 7,624 7,712 7,805 7,903 8,062 8,142 8,272 8,411 8,592 8,762 8,937
Step by Step Solution
★★★★★
3.36 Rating (159 Votes )
There are 3 Steps involved in it
Step: 1
1 Calculating the Monthly Rate of Infection The monthly rate of infection can be calculated by taking the total number of infected people from the beg...
Get Instant Access to Expert-Tailored Solutions
See step-by-step solutions with expert insights and AI powered tools for academic success
Step: 2

Step: 3

Ace Your Homework with AI
Get the answers you need in no time with our AI-driven, step-by-step assistance
Get Started


