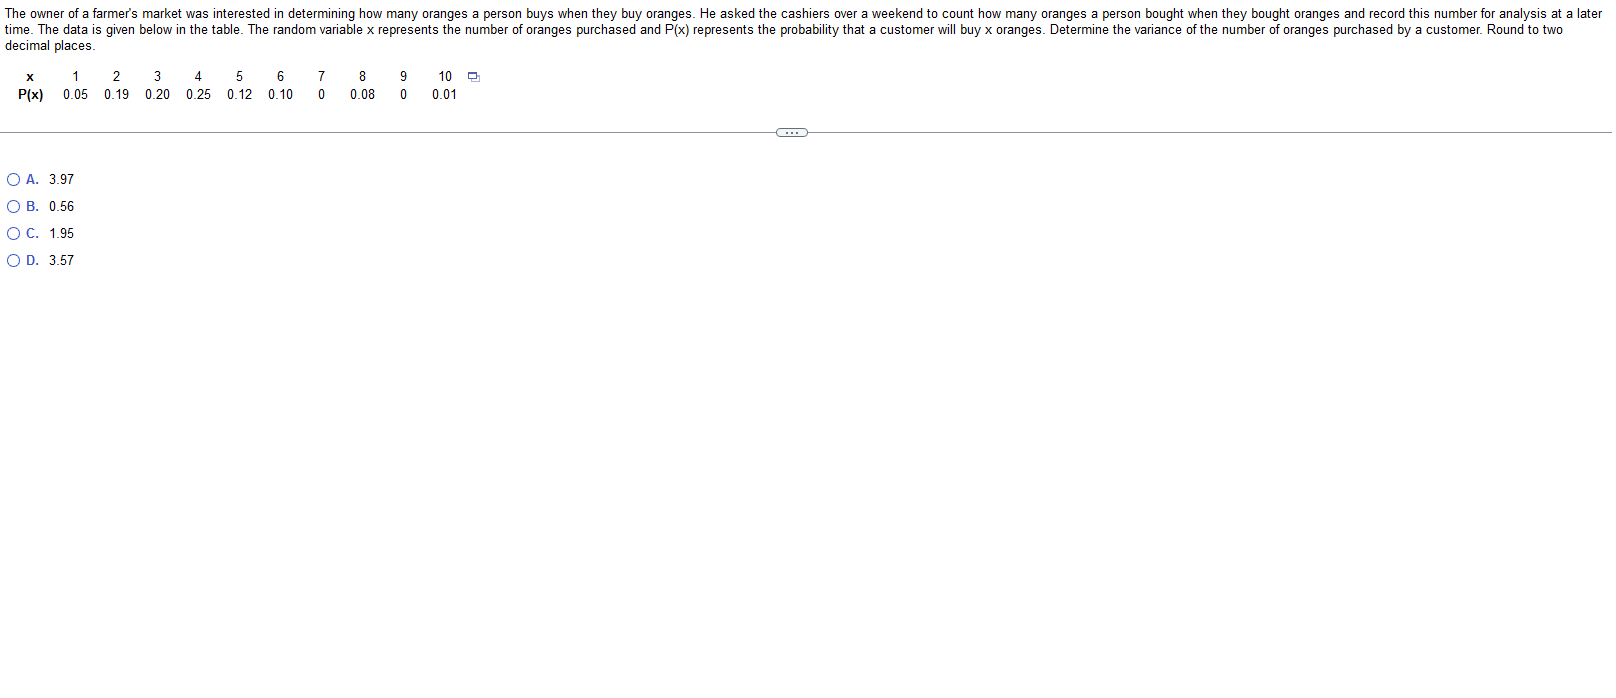
An insurance company crashed four cars in succession at 5 miles per hour. The cost of repair for each of the four crashes was $410,
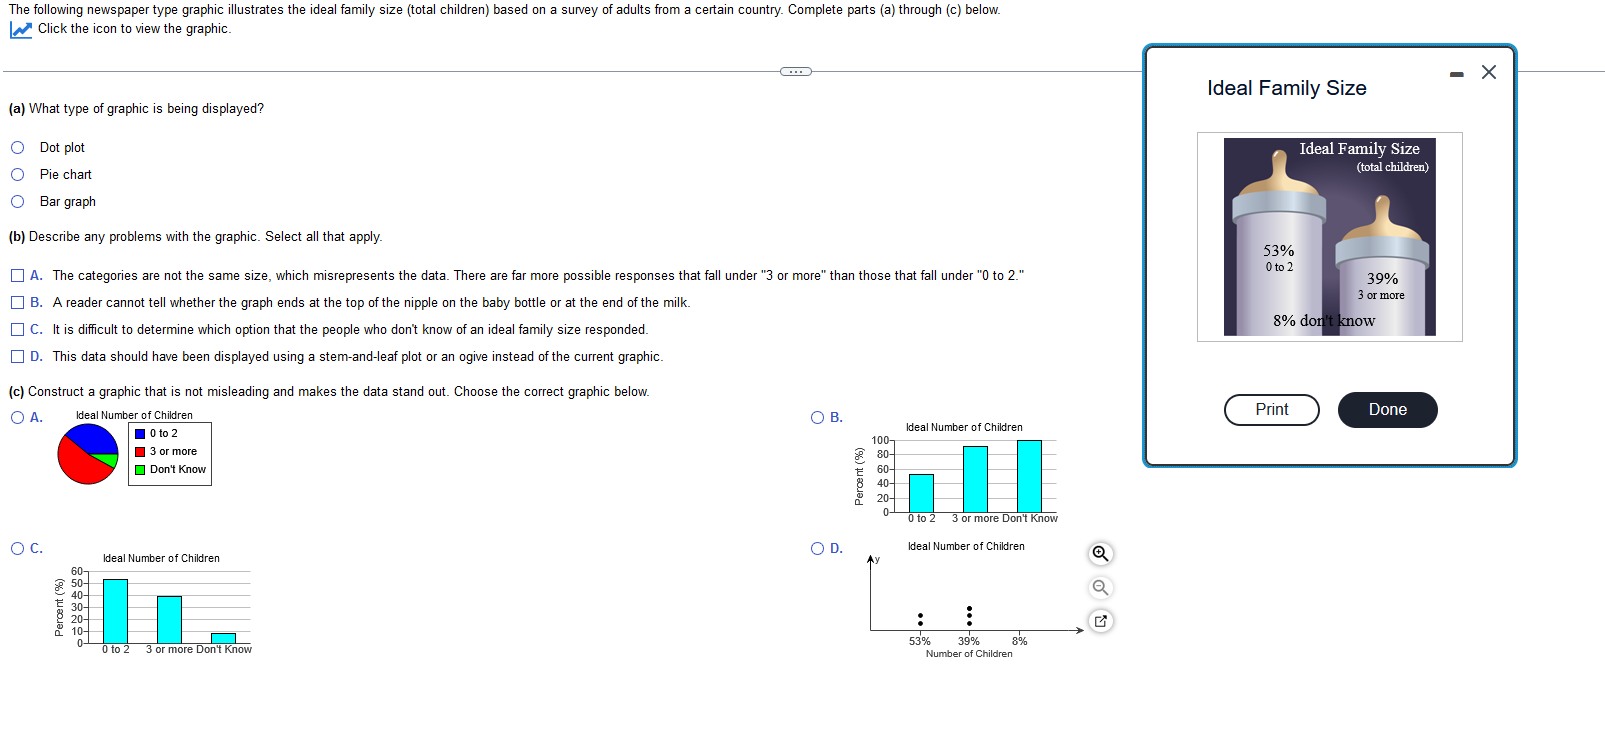
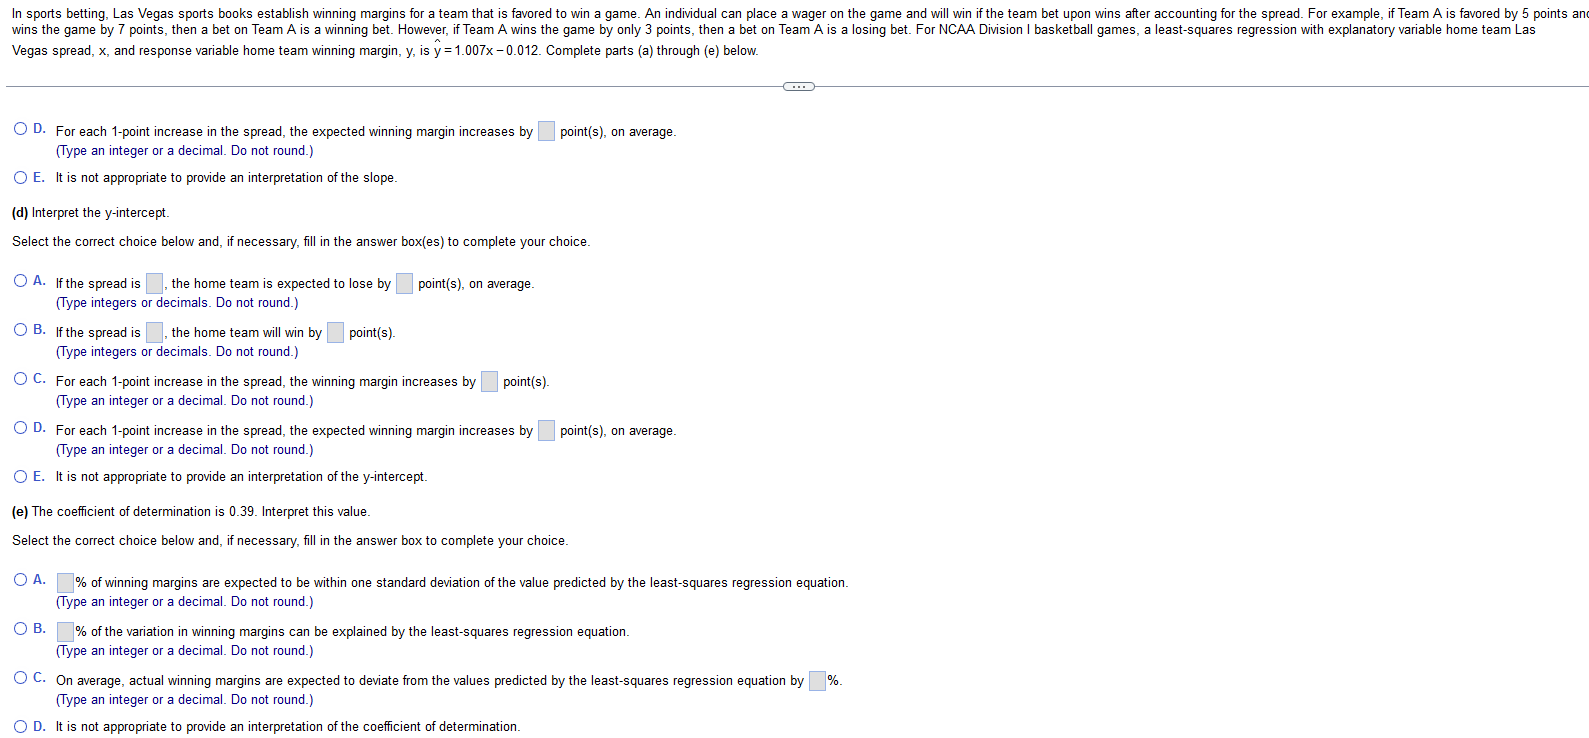
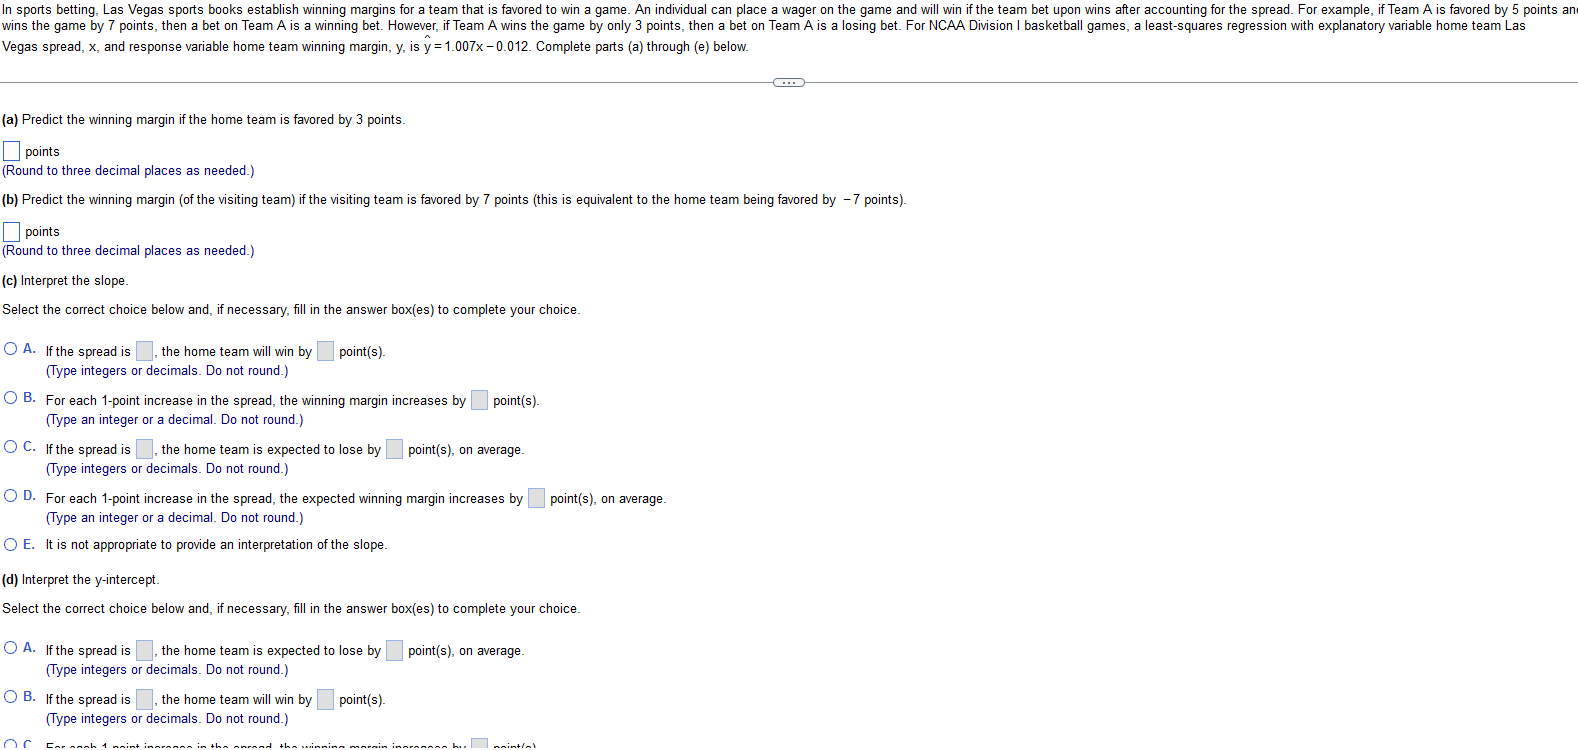
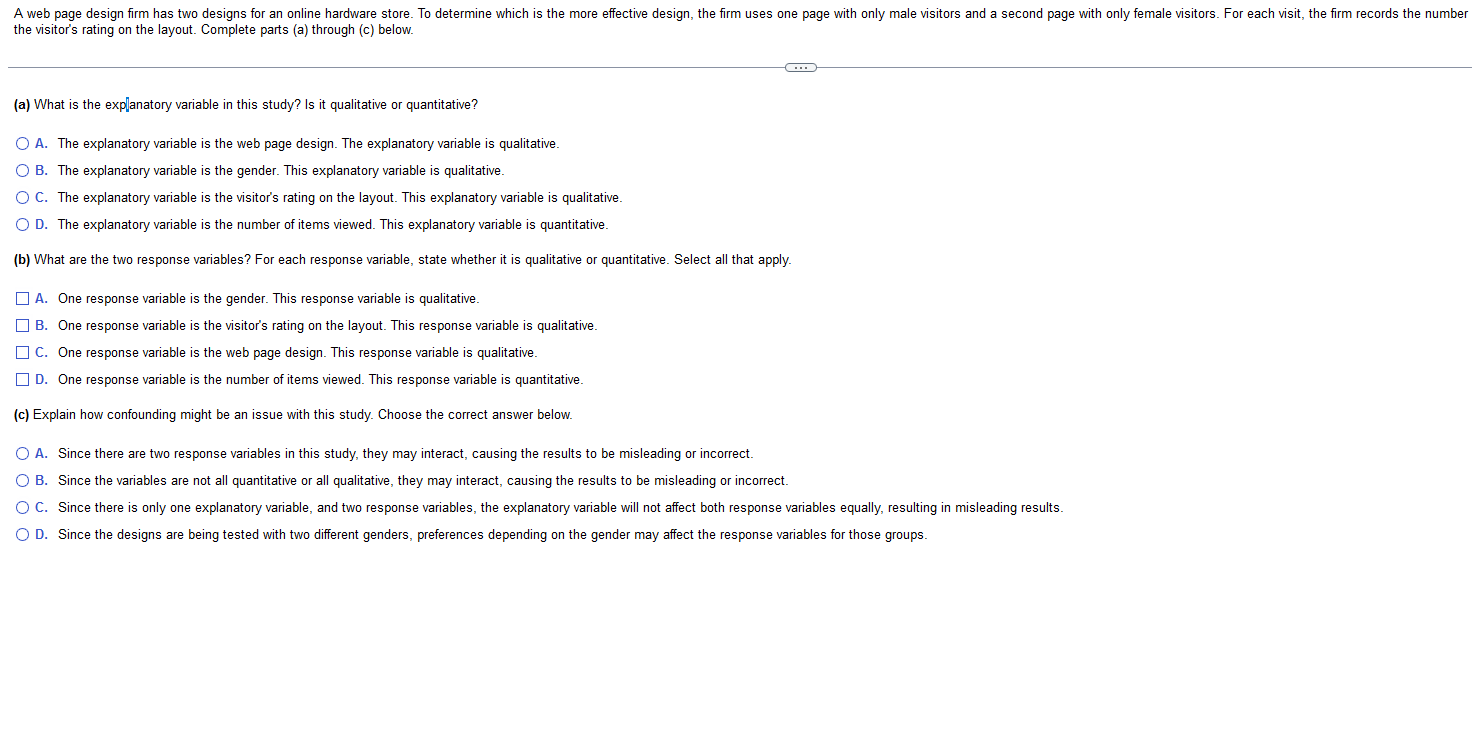
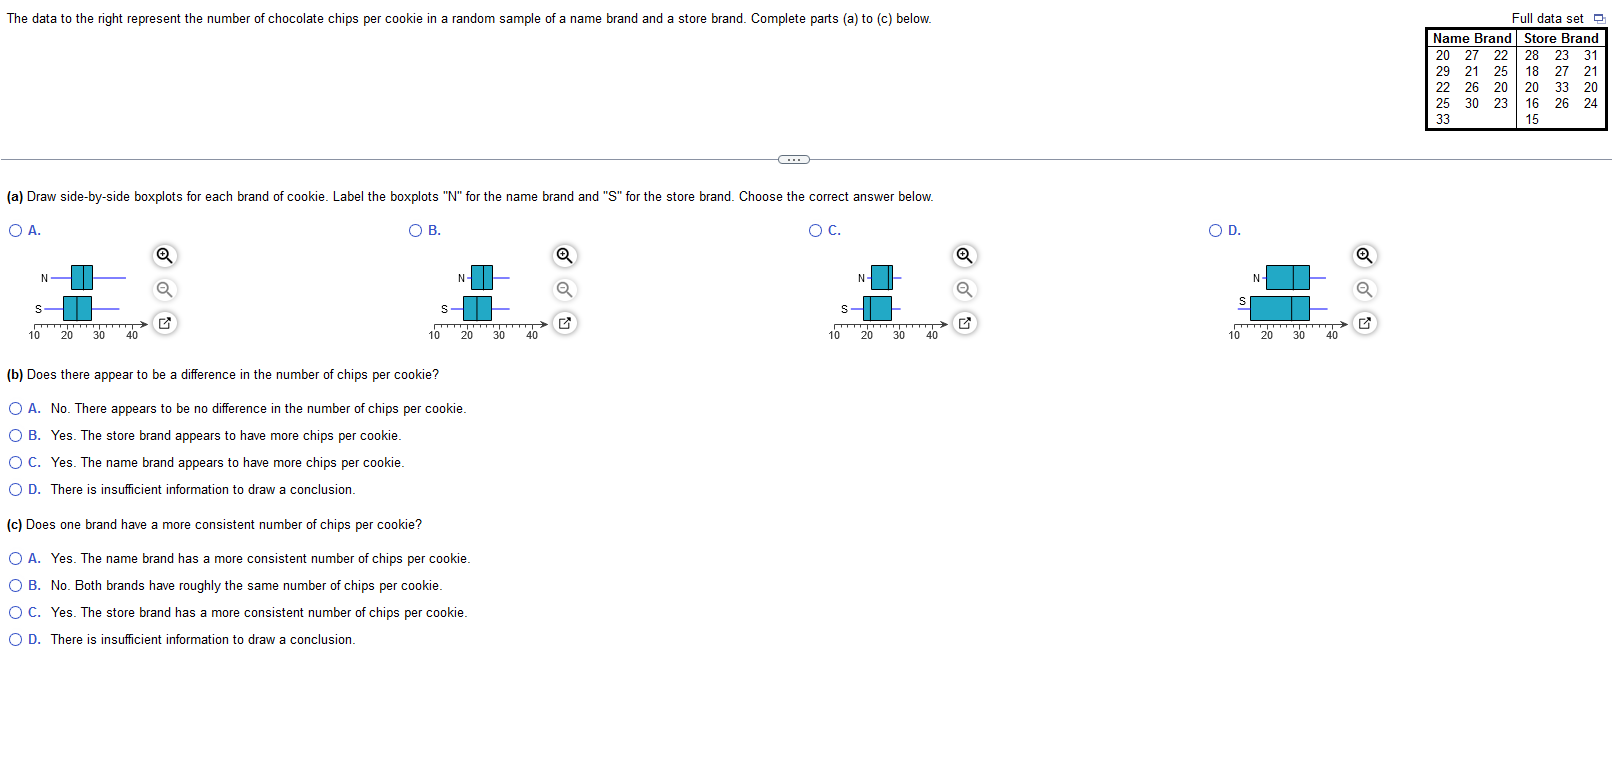
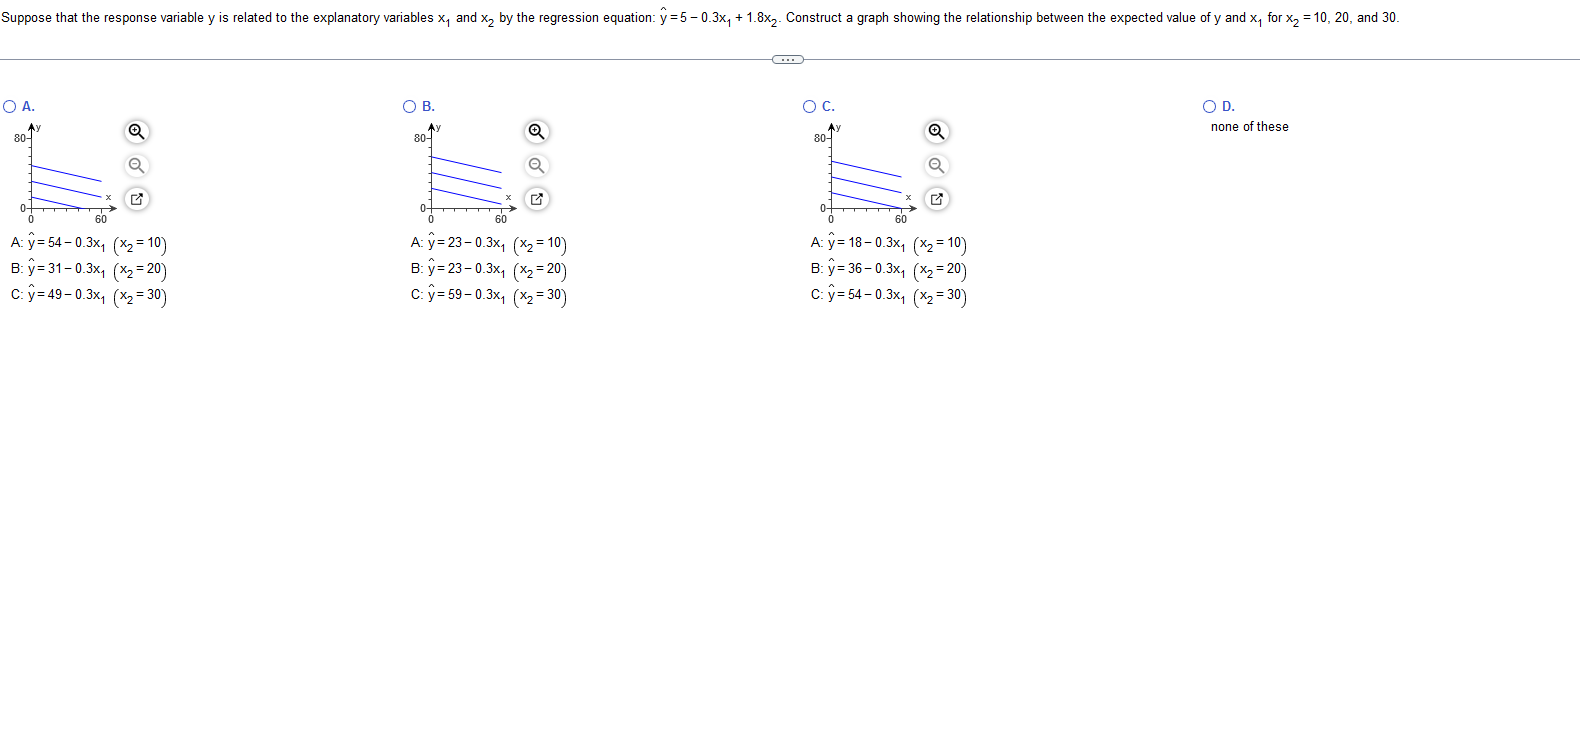
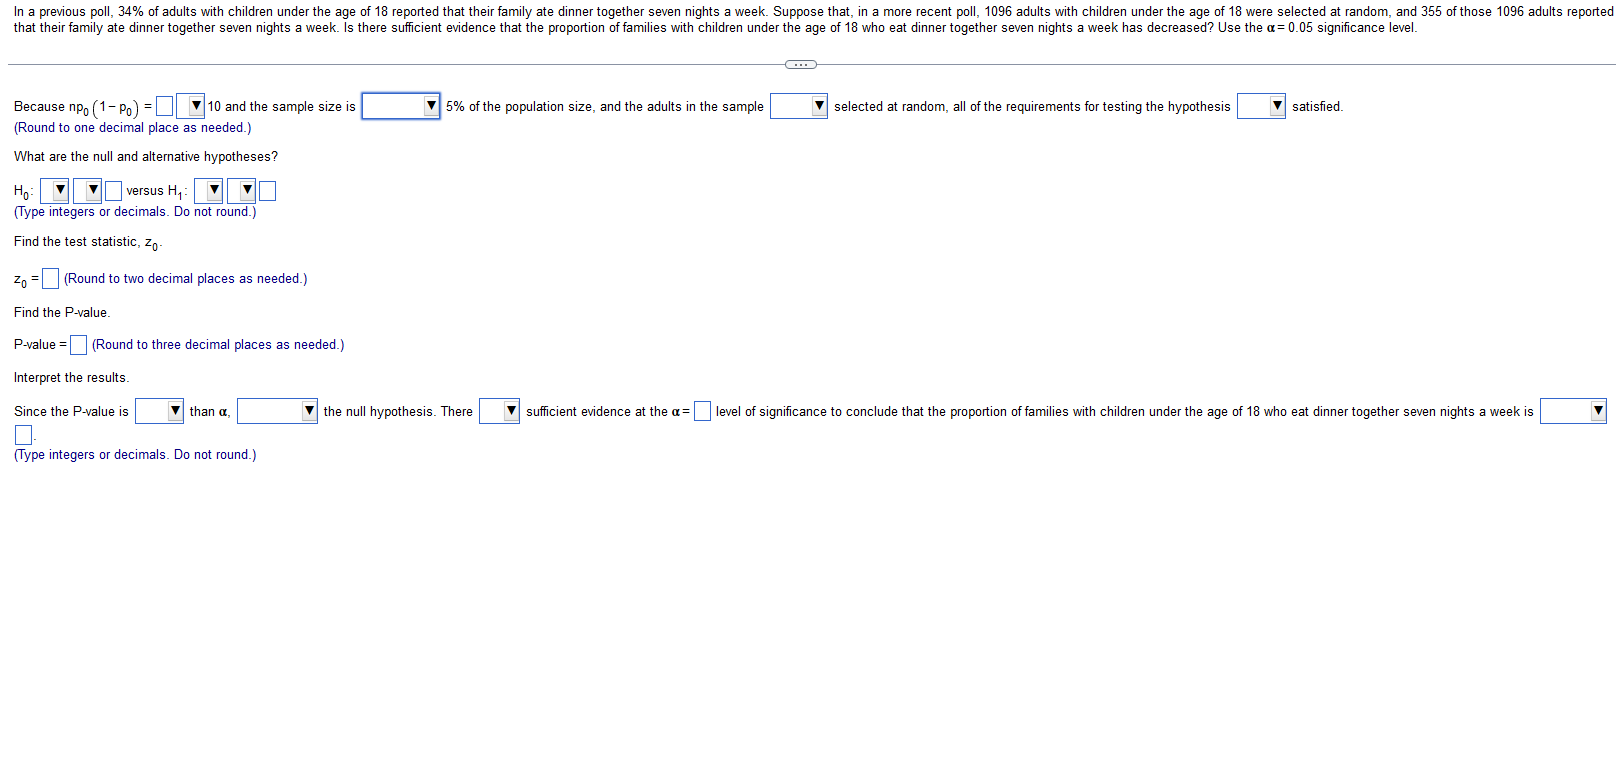
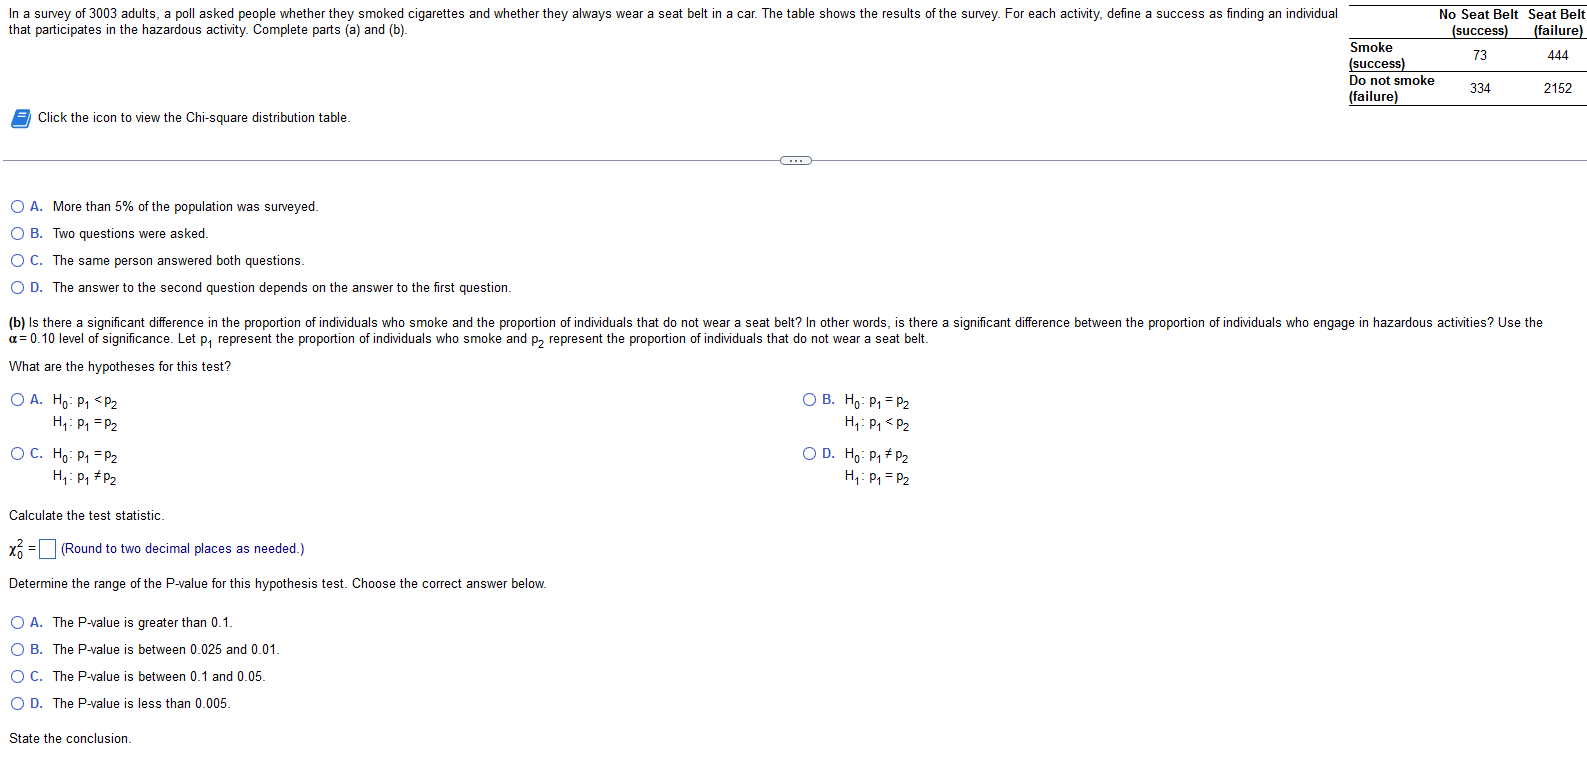
An insurance company crashed four cars in succession at 5 miles per hour. The cost of repair for each of the four crashes was $410, 5466, $409, 5211 [5] . Compute the range, sample variance, and sample standard deviation cost of repair. The range is 5% = dollars? (Round to the nearest whole number as needed ) s= (Round to two decimal places as needed.) The following newspaper type graphic illustrates the ideal family size (total children) based on a survey of adults from a certain country. Complete parts (a) through (c) below. Click the icon to view the graphic. - X Ideal Family Size (a) What type of graphic is being displayed? O Dot plot deal Family Size (total children) O Pie chart O Bar graph (b) Describe any problems with the graphic. Select all that apply. 53% 0 to 2 A. The categories are not the same size, which misrepresents the data. There are far more possible responses that fall under "3 or more" than those that fall under "0 to 2." 39% OB. A reader cannot tell whether the graph ends at the top of the nipple on the baby bottle or at the end of the milk. 3 or more OC. It is difficult to determine which option that the people who don't know of an ideal family size responded 8% don't know OD. This data should have been displayed using a stem-and-leaf plot or an ogive instead of the current graphic. (c) Construct a graphic that is not misleading and makes the data stand out. Choose the correct graphic below. O A. Ideal Number of Children O B. Print Done 0 to 2 deal Number of Children 100- 3 or more 80- Don't Know 60- Percent (%) 40- 20- 0 to 2 3 or more Don't Know O C. O D. Ideal Number of Children Ideal Number of Children 60- 50- 40- Percent (9%) 30- 20- 10- TO 53% 39% 8% 0 to 2 3 or more Don't Know Number of ChildrenIn sports betting, Las Vegas sports books establish winning margins for a team that is favored to win a game. An individual can place a wager on the game and will win if the team bet upon wins after accounting for the spread. For example, if Team A is favored by 5 points an wins the game by 7 points, then a bet on Team A is a winning bet. However, if Team A wins the game by only 3 points, then a bet on Team A is a losing bet. For NCAA Division | basketball games, a least-squares regression with explanatory variable home team Las Vegas spread, x, and response variable home team winning margin, y, is y = 1.007x -0.012. Complete parts (a) through (e) below. O D. For each 1-point increase in the spread, the expected winning margin increases by |point(s), on average. Type an integer or a decimal. Do not round.) O E. It is not appropriate to provide an interpretation of the slope. (d) Interpret the y-intercept. Select the correct choice below and, if necessary, fill in the answer box(es) to complete your choice. O A. If the spread is , the home team is expected to lose by point(s), on average. Type integers or decimals. Do not round.) O B. If the spread is , the home team will win by point(s). Type integers or decimals. Do not round.) O C. For each 1-point increase in the spread, the winning margin increases by point(s). Type an integer or a decimal. Do not round.) O D. For each 1-point increase in the spread, the expected winning margin increases by point(s), on average. Type an integer or a decimal. Do not round.) O E. It is not appropriate to provide an interpretation of the y-intercept. (e) The coefficient of determination is 0.39. Interpret this value. Select the correct choice below and, if necessary, fill in the answer box to complete your choice. O A. % of winning margins are expected to be within one standard deviation of the value predicted by the least-squares regression equation. (Type an integer or a decimal. Do not round.) O B. % of the variation in winning margins can be explained by the least-squares regression equation. Type an integer or a decimal. Do not round.) O C. On average, actual winning margins are expected to deviate from the values predicted by the least-squares regression equation by % Type an integer or a decimal. Do not round.) O D. It is not appropriate to provide an interpretation of the coefficient of determination.In sports betting, Las Vegas sports books establish winning margins for a team that is favored to win a game. An individual can place a wager on the game and will win if the team bet upon wins after accounting for the spread. For example, if Team A is favored by 5 points an wins the game by 7 points, then a bet on Team A is a winning bet. However, if Team A wins the game by only 3 points, then a bet on Team A is a losing bet. For NCAA Division I basketball games, a least-squares regression with explanatory variable home team Las Vegas spread, x, and response variable home team winning margin, y, is y = 1.007x -0.012. Complete parts (a) through (e) below. (a) Predict the winning margin if the home team is favored by 3 points. points (Round to three decimal places as needed.) (b) Predict the winning margin (of the visiting team) if the visiting team is favored by 7 points (this is equivalent to the home team being favored by - 7 points). points Round to three decimal places as needed.) (c) Interpret the slope. Select the correct choice below and, if necessary, fill in the answer box(es) to complete your choice. O A. If the spread is , the home team will win by |point(s). Type integers or decimals. Do not round.) O B. For each 1-point increase in the spread, the winning margin increases by |point(s). Type an integer or a decimal. Do not round.) O C. If the spread is , the home team is expected to lose by |point(s), on average. Type integers or decimals. Do not round.) O D. For each 1-point increase in the spread, the expected winning margin increases by |point(s), on average. Type an integer or a decimal. Do not round.) O E. It is not appropriate to provide an interpretation of the slope. (d) Interpret the y-intercept. Select the correct choice below and, if necessary, fill in the answer box(es) to complete your choice. O A. If the spread is , the home team is expected to lose by point(s), on average. Type integers or decimals. Do not round.) O B. If the spread is , the home team will win by point(s). Type integers or decimals. Do not round.)A web page design firm has two designs for an online hardware store. To determine which is the more effective design. the firm uses one page with only male visitors and a second page with only female visitors. For each visit, the firm records the number the visitor's rating on the layout. Complete parts (a) through (c) below. (a) What is the exglanatory variable in this study? Is it qualitative or quantitative? (O A. The explanatory variable is the web page design. The explanatory variable is qualitative. . The explanatory variable is the gender. This explanatory variable is qualitative. . The explanatory variable is the visitor's rating on the layout. This explanatory variable is qualitative. . The explanatory variable is the number of items viewed. This explanatory variable is quantitative. (b) What are the two response variables? For each response variable, state whether it is qualitative or quantitative. Select all that apply. One response variable is the gender. This response variable is qualitative. One response variable is the visitor's rating on the layout. This response variable is qualitative. One response variable is the web page design. This response variable is qualitative. o0 @ P One response variable is the number of items viewed. This response variable is quantitative. (c) Explain how confounding might be an issue with this study. Choose the correct answer below. Since there are two response variables in this study, they may interact, causing the results to be misleading or incarrect. Since the variables are not all quantitative or all qualitative, they may interact, causing the results to be misleading or incorrect. Since there is only one explanatory variable, and two response variables, the explanatory variable will not affect both response variables equally, resulting in misleading results. Since the designs are being tested with two different genders, preferences depending on the gender may affect the response variables for those groups. The data to the right represent the number of chocolate chips per cookie in a random sample of a name brand and a store brand. Complete parts (a) to (c) below. Full data set = (a) Draw side-by-side boxplots for each brand of cookie. Label the boxplots for the name brand and "S" for the store brand. Choose the correct answer below. O A O B. QOc. QD Q & & Q i a Il & - & i - & il - |l o o e O 10 20 30 40 10 20 30 40 10 20 30 40 10 20 30 40 (b) Does there appear to be a difference in the number of chips per cookie? () A. No. There appears to be no difference in the number of chips per cookie. () B. Yes. The store brand appears to have more chips per cookie. (O . Yes. The name brand appears to have more chips per cookie. () D. There is insufficient information to draw a conclusian. (c) Does one brand have a more consistent number of chips per cookie? (O A. Yes. The name brand has a more consistent number of chips per cookie. (0 B. No. Both brands have roughly the same number of chips per cookie. (O C. Yes. The store brand has a more consistent number of chips per cookie. () D. There is insufficient information ta draw a conclusion. Suppose that the response variable y is related to the explanatory variables x, and x2 by the regression equation: y =5 -0.3x, + 1.8x2. Construct a graph showing the relationship between the expected value of y and x, for X2 = 10, 20, and 30. OD. O A. O B. O C. none of these 60 0- A: y= 18- 0.3X1 (X2 = 10) A: y= 54 - 0.3X1 (X2 = 10) A: y= 23- 0.3x1 (X2 = 10) B: y= 23-0.3x1 (X2= 20) B: y= 36- 0.3x1 (X2 = 20) B: y= 31- 0.3x1 (X2 = 20) C: y= 49- 0.3x1 (X2 = 30) C: y= 59- 0.3*1 (X2 = 30) C: y= 54 -0.3x1 (X2= 30)In a previous poll, 34% of adults with children under the age of 18 reported that their family ate dinner together seven nights a week. Suppose that, in a more recent poll, 1096 adults with children under the age of 18 were selected at random, and 355 of those 1096 adults reported that their family ate dinner together seven nights a week. Is there sufficient evidence that the proportion of families with children under the age of 18 who eat dinner together seven nights a week has decreased? Use the a= 005 significance level. Because npy (1 - pu) = |10 and the sample size is | 5% of the population size. and the adults in the sample V| selected at random., all of the requirements for testing the hypothesis V| satisfied. (Round to one decimal place as needed.) What are the null and alternative hypotheses? Hp: | Y| versus Hyo | (V|| (Type integers or decimals. Do not round.} Find the test statistic, z;. 2y =| | (Round to two decimal places as needed.) Find the Pvalue. P-value =| | (Round to three decimal places as needed ) Interpret the results. -
Step by Step Solution
There are 3 Steps involved in it
Step: 1
Get Instant Access to Expert-Tailored Solutions
See step-by-step solutions with expert insights and AI powered tools for academic success
Step: 2
Step: 3
Ace Your Homework with AI
Get the answers you need in no time with our AI-driven, step-by-step assistance