Answered step by step
Verified Expert Solution
Question
1 Approved Answer
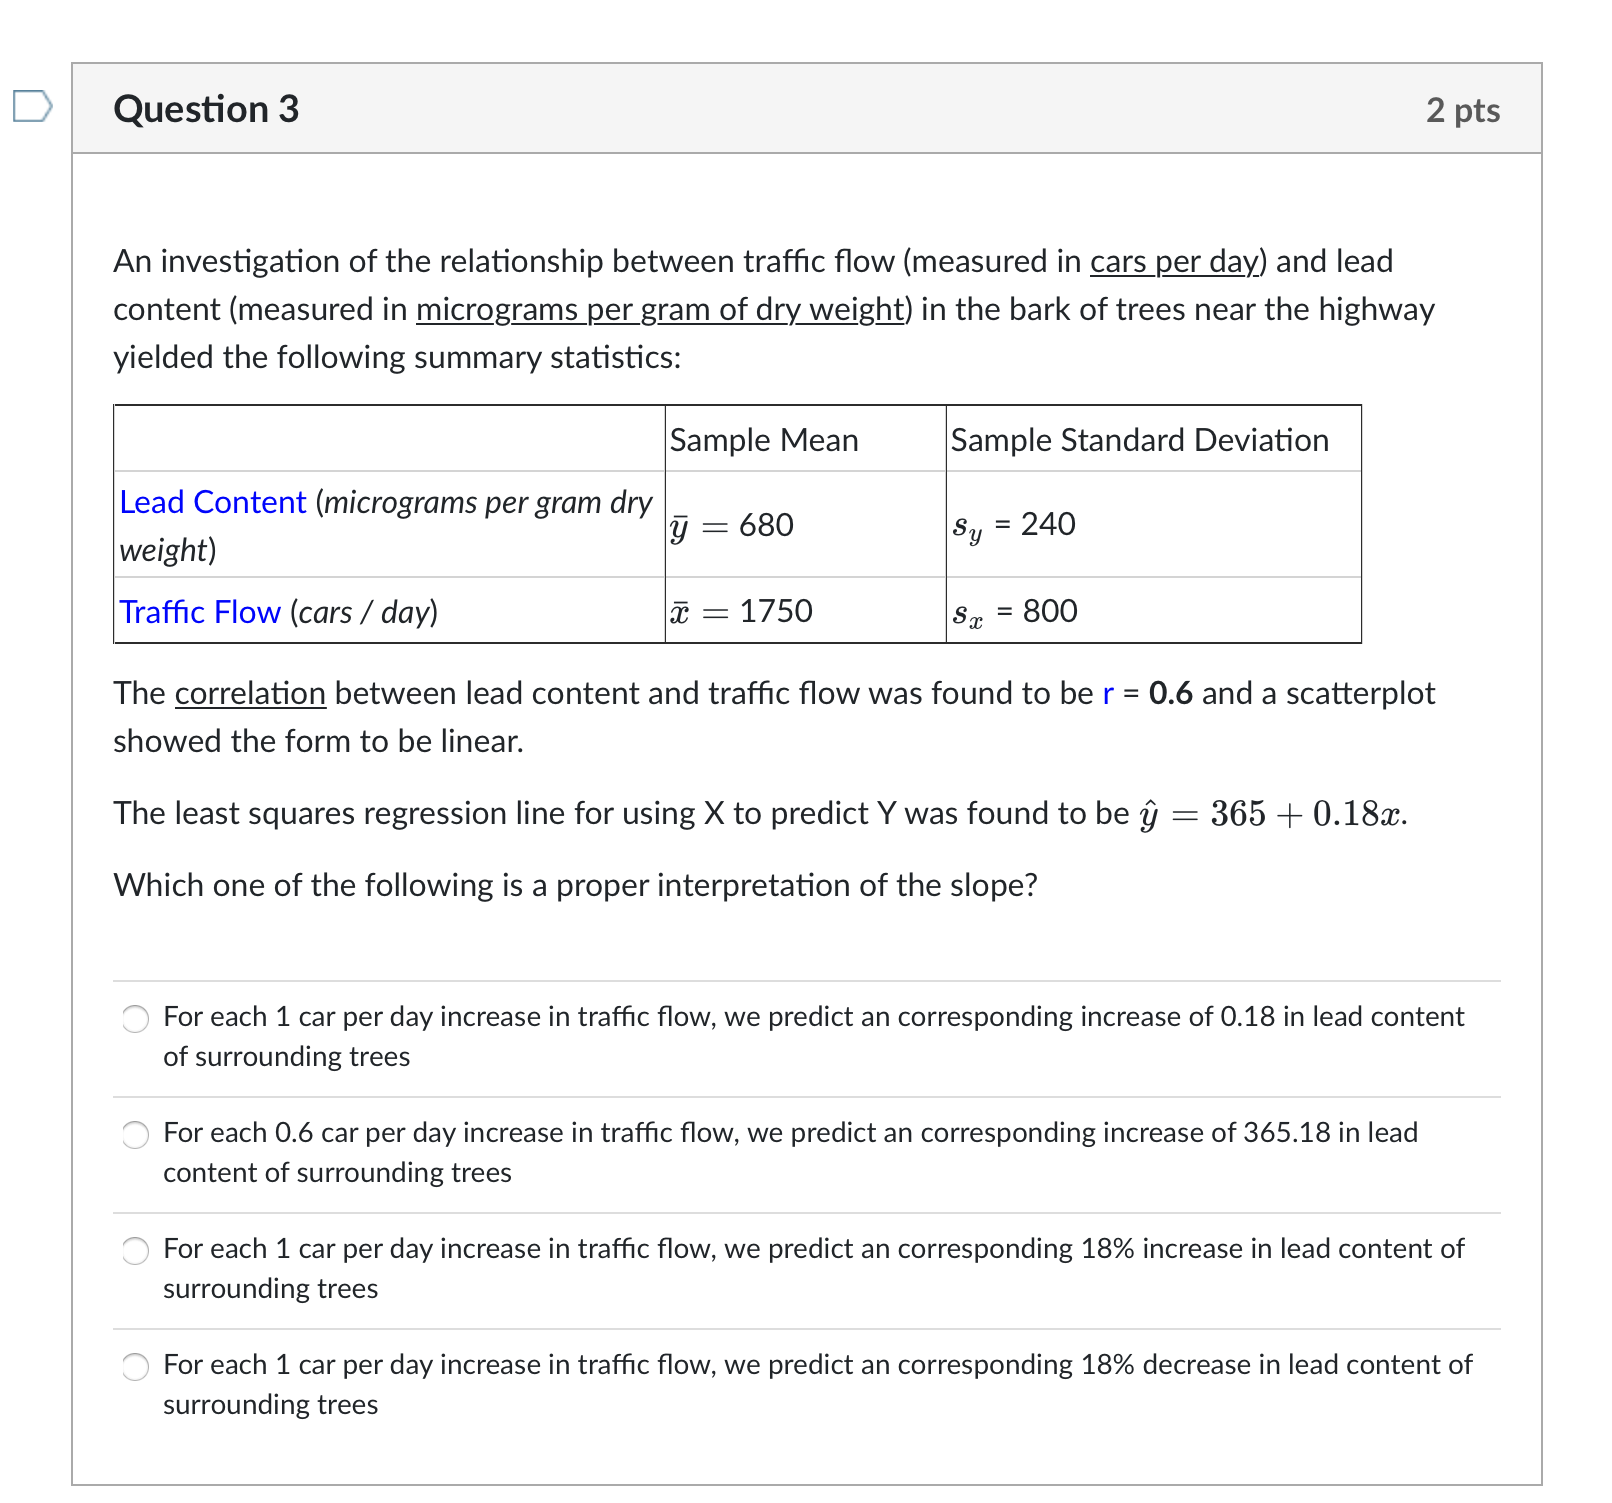
An investigation of the relationship between traffic flow (measured in cars per day) and lead content (measured in micrograms per gram of dry weight) in
 An investigation of the relationship between traffic flow (measured in cars per day) and lead content (measured in micrograms per gram of dry weight) in the bark of trees near the highway yielded the following summary statistics: The correlation between lead content and traffic flow was found to be r=0.6 and a scatterplot showed the form to be linear. The least squares regression line for using X to predict Y was found to be y^=365+0.18x. Which one of the following is a proper interpretation of the slope? For each 1 car per day increase in traffic flow, we predict an corresponding increase of 0.18 in lead content of surrounding trees For each 0.6 car per day increase in traffic flow, we predict an corresponding increase of 365.18 in lead content of surrounding trees For each 1 car per day increase in traffic flow, we predict an corresponding 18\% increase in lead content of surrounding trees For each 1 car per day increase in traffic flow, we predict an corresponding 18\% decrease in lead content of surrounding trees
 Step by Step Solution
There are 3 Steps involved in it
Step: 1

Get Instant Access to Expert-Tailored Solutions
See step-by-step solutions with expert insights and AI powered tools for academic success
Step: 2

Step: 3

Ace Your Homework with AI
Get the answers you need in no time with our AI-driven, step-by-step assistance
Get Started


