Answered step by step
Verified Expert Solution
Question
1 Approved Answer
An IOT system is illustrated in the figure below. As seen at the bottom of this system, data is collected from different sensors (temperature, humidity,
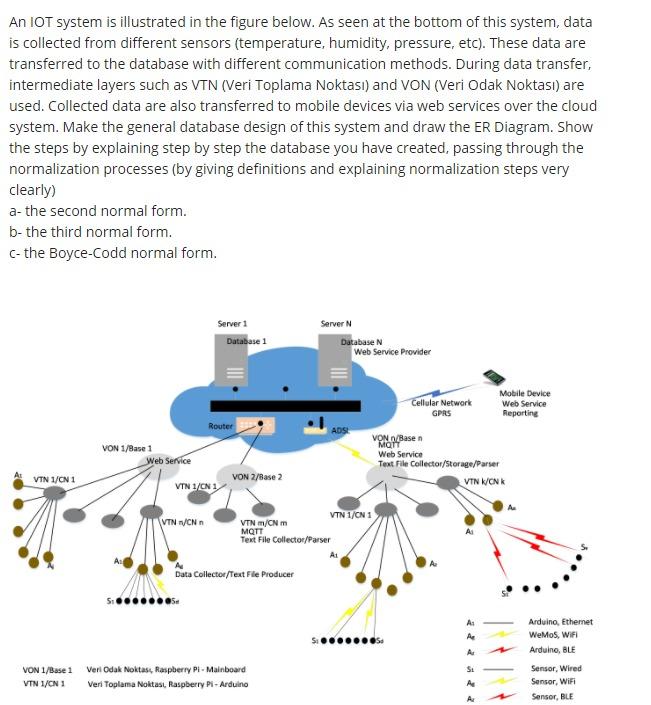
An IOT system is illustrated in the figure below. As seen at the bottom of this system, data is collected from different sensors (temperature, humidity, pressure, etc). These data are transferred to the database with different communication methods. During data transfer, intermediate layers such as VIN (Veri Toplama Noktas) and VON (Veri Odak Noktas) are used. Collected data are also transferred to mobile devices via web services over the cloud system. Make the general database design of this system and draw the ER Diagram. Show the steps by explaining step by step the database you have created, passing through the normalization processes (by giving definitions and explaining normalization steps very clearly) a-the second normal form. b- the third normal form. C- the Boyce-Codd normal form. Server 1 Database 1 Server N Database N Web Service Provider Cellular Network GPRS Mobile Device Web Service Reporting Router VON 1/Base 1 Web Service VON /Basen MOTT Web Service Text File Collector/Storage/Parser VIN ON VTN 1/CN1 VON 2/Base 2 VTN 1/CN1 VTN w/CN VTN 1/CN1 VTN M/CN m MQTT Text File Collector/Parser Data Collector/Text File Producer A. Ae Arduino, Ethernet WeMOS, WiFi Arduino, BLE St VON 1/Base 1 VTN 1/CN1 Verl Odak Noktas, Raspberry Pi - Mainboard Veri Toplama Noktas, Raspberry Pi - Arduino A Sensor, Wired Sensor, WiFi Sensor, BLE
Step by Step Solution
There are 3 Steps involved in it
Step: 1
Get Instant Access to Expert-Tailored Solutions
See step-by-step solutions with expert insights and AI powered tools for academic success
Step: 2
Step: 3
Ace Your Homework with AI
Get the answers you need in no time with our AI-driven, step-by-step assistance
Get Started