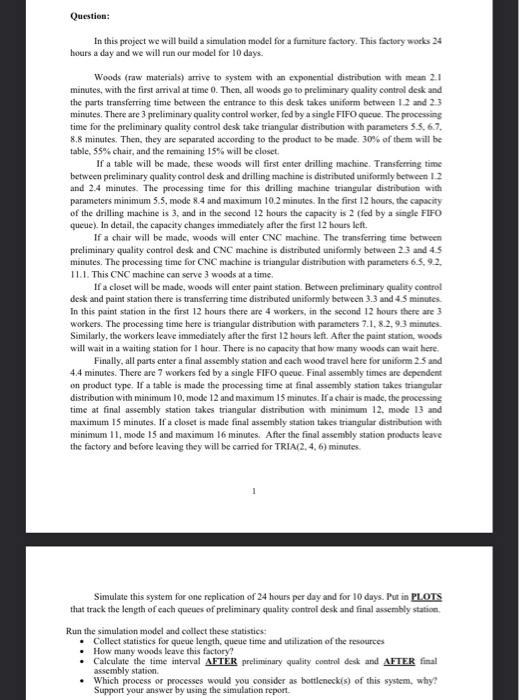
In this project we will build a simulation model for a fumiture factory. This factory works 24 hours a day and we will run our model for 10 days. Woods (raw materials) arrive to system with an exponential distribution with mean 2.1 minutes, with the first arrival at time 0 . Then, all woods go to preliminary quality control desk and the parts transferring time between the entrance to this desk takes uniform between 1.2 and 2.3 minutes. There are 3 preliminary quality control worker, fed by a single FIFO queue. The processing time for the preliminary quality control desk take triangular distribution with parameters 5.5,6.7. 8.8 minutes. Then, they are separated according to the prodact to be made. 30% of then will be table, 55% chair, and the remaining 15% will be closet. If a table will be made, these woods will first enter drilling machine. Transferring time between preliminary quality control desk and drilling machine is distributed uniformly between 1.2 and 2.4 minutes. The processing time for this drilling machine triangular distribution with parameters minimum 5.5, mode 8.4 and maximum 10.2 minutes. In the first 12 hours, the capacity of the drilling machine is 3 , and in the second 12 hours the capacity is 2 (feed by a single FIFO queae). In detail, the capacity changes immediately after the first 12 bours left. If a chair will be made, woods will enter CNC machine. The transferring tirne between preliminary quality control desk and CNC machine is distributed uniformly between 2.3 and 4.5 minutes. The processing time for CNC machine is triangular distribution with parameters 6.5,9.2, 11.1. This CNC machine can serve 3 woods at a time. If a closet will be made, woods will enter paint station. Between preliminary qualify control desk and paint station there is transferring time distributed uniformly between 3.3 and 4.5 minutes. In this paint station in the first 12 hours there are 4 workers, in the second 12 hours there are 3 workers. The processing time here is triangular distribution with parameters 7.1, 8.2, 9.3 minutes. Similarly, the workers leave immediately after the first 12 bours left. After the paint station, woods will wait in a waiting station for I hour. There is no capacity that how many woods can wait here. Finally, all parts enter a final assembly station and each wood travel bere for uniform 2.5 and 4.4 minutes. There are 7 workers fed by a single FIFO queue. Final assembly times are dependent on product type. If a table is made the processing time at final assembly station talkes triangular distribution with minimum 10 , mode 12 and maximum 15 minutes. If a chair is made, the processing time at final assembly station takes triangular distribution with minimum 12, mode 13 and maximum 15 minutes. If a closet is made final assembly station takes triangular distribution with minimum 11, mode 15 and maximum 16 minutes. After the final assenubly station products leave the factory and before leaving they will be carried for TRIA(2,4,6) minutes. Simulate this system for one replication of 24 hours per day and for 10 days. Put in R1.OTs that track the length of each queues of preliminary quality control desk and final assembly station, Run the simulation model and collect these statistics: - Collect statistics for queue length, queue time and utilization of the resocrees - How many woods leave this factory? - Calculate the time interval SFTER preliminary quality coatrol desk and AFTER final assembly station. - Which process or processes would you consider as bottleneck(s) of this system, why? Support your answer by using the simulation report


