

Question
An NPV profile plots a projects NPV at various costs of capital. A projects NPV profile is shown in the graph. Identify the range of
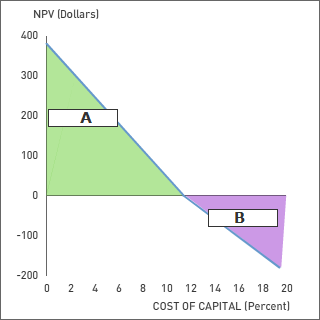
An NPV profile plots a projects NPV at various costs of capital. A projects NPV profile is shown in the graph. Identify the range of costs of capital that a firm would use to accept and reject this project by responding to the drop-down choices below the graph.
| A | Accept/Reject? |
| B | Accept/Reject? |
This NPV profile demonstrates that as the cost of capital increases, the projects NPV increases/decreases? .
NPV (Dollars) 400 300 200 A 100 0 B -100 -200 0 2 4 6 8 10 12 14 16 18 20 COST OF CAPITAL (Percent)Step by Step Solution
There are 3 Steps involved in it
Step: 1

Get Instant Access to Expert-Tailored Solutions
See step-by-step solutions with expert insights and AI powered tools for academic success
Step: 2

Step: 3
Ace Your Homework with AI
Get the answers you need in no time with our AI-driven, step-by-step assistance
Get Started
Dropshipping How To Build And Scale An Online Dropshipping Business To Six Figures Working From Home
Authors: John Swann
1st Edition
1522092404, 978-1522092407