Answered step by step
Verified Expert Solution
Question
1 Approved Answer
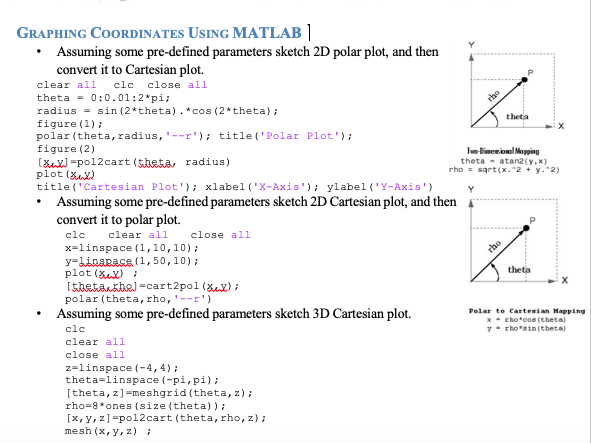
an related example that you can use ^^ by using Matlab:(CODING) 1- Alter the parameters in polar and Cartesian 2D-plot and sketch some different plots.

an related example that you can use ^^
by using Matlab:(CODING)
1- Alter the parameters in polar and Cartesian 2D-plot and sketch some different plots. Paste your code and plots here, explain what happened with changed parameters.
2- Alter the parameters in polar and Cartesian 3D-plot and sketch some different plots.Paste your code and plots, explain what happened with changed parameters.
GRAPHING COORDINATES USING MATLAB Assuming some pre-defined parameters sketch 2D polar plot, and then convert it to Cartesian plot. clear all clc close all theta - 0:0.01:2*pi; radius = sin (2*theta). *cos(2*theta); theta figure(1); polar (theta, radius,'--'); title('Polar Plot'); figure (2) Iwo meional Mapping (XX] =pol2cart (theta radius) theta - atan(y,x) plot (u) rho = sqrt(x2 + y. 2) title('Cartesian Plot'); xlabel("X-Axis'); ylabel('Y-Axis') Assuming some pre-defined parameters sketch 2D Cartesian plot, and then convert it to polar plot. clc clear all close all x=linspace (1,10,10); y=Base (1,50, 10); plot(s) theta thetase] -cart2pol (1) polar (theta, rho,'--') Assuming some pre-defined parameters sketch 3D Cartesian plot. Polar to Cartesian Mapping 1 - Kho*co the ta] clc y - cho'sin(theta) clear all close all z=linspace (-4,4); theta=linspace (-pi,pi); [theta, z)=meshgrid(theta, z); rho=8*ones (size (theta)); (x, y, z)=pol2cart (theta, rho, z); mesh (x, y, z); cho GRAPHING COORDINATES USING MATLAB Assuming some pre-defined parameters sketch 2D polar plot, and then convert it to Cartesian plot. clear all clc close all theta - 0:0.01:2*pi; radius = sin (2*theta). *cos(2*theta); theta figure(1); polar (theta, radius,'--'); title('Polar Plot'); figure (2) Iwo meional Mapping (XX] =pol2cart (theta radius) theta - atan(y,x) plot (u) rho = sqrt(x2 + y. 2) title('Cartesian Plot'); xlabel("X-Axis'); ylabel('Y-Axis') Assuming some pre-defined parameters sketch 2D Cartesian plot, and then convert it to polar plot. clc clear all close all x=linspace (1,10,10); y=Base (1,50, 10); plot(s) theta thetase] -cart2pol (1) polar (theta, rho,'--') Assuming some pre-defined parameters sketch 3D Cartesian plot. Polar to Cartesian Mapping 1 - Kho*co the ta] clc y - cho'sin(theta) clear all close all z=linspace (-4,4); theta=linspace (-pi,pi); [theta, z)=meshgrid(theta, z); rho=8*ones (size (theta)); (x, y, z)=pol2cart (theta, rho, z); mesh (x, y, z); choStep by Step Solution
There are 3 Steps involved in it
Step: 1

Get Instant Access to Expert-Tailored Solutions
See step-by-step solutions with expert insights and AI powered tools for academic success
Step: 2

Step: 3

Ace Your Homework with AI
Get the answers you need in no time with our AI-driven, step-by-step assistance
Get Started


