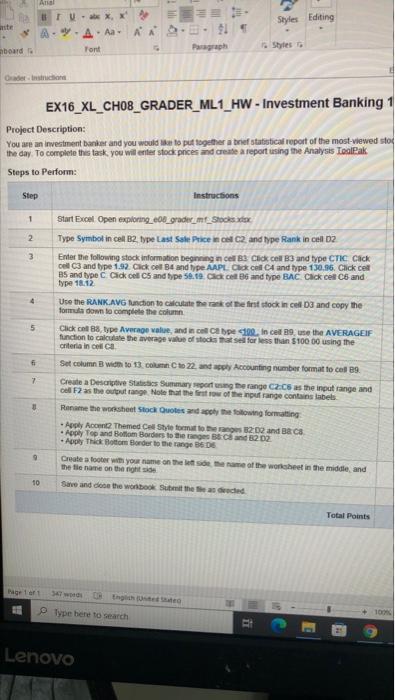
Anal TU Styles Editing site A RASI Paragraph Font aboard Styles Caderns EX16_XL_CH08_GRADER_ML1_HW - Investment Banking 1 Project Description: You are an investment Banker and you would to put together a brief statistical report of the most viewed sto the day. To complete this task, you will enter stock prices and create a report using the Analysis Talpak Steps to Perform: Step Instructions 1 2 Start Excel Open exploring_608_grader_mf_Shoes Type Symbol in cel B2 Type Last Salt Price in calc2 and type Rank in cel D2 Enter the following stock information beginning in cell 3 Click cell B3 and type CTIC Cack cel c3 and type 1.92. Click el B4 andype AAPL Click cell CA and type 130.36. Click cel BS and type C Click cel C5 and type 50.19. Ole and type BAC. Click cell C6 and type 18.12 3 5 6 Use the RANK.AVG function to calculate the rank of the first stock incel and copy the formula down to complete the column Click col 88, type Average value, and incl be 100. In cel 89, use the AVERAGEIF function to calculate the average value of toda atsed for less than $10000 using the criteria in colla Set column width to 13 column to 22. andy Accounting number format to code Create a Descriptive Statistics Summary reporting the range C2.5 as the input range and F2 as the output range. Note that the first row of the input range contains labels Rename the worksheet Stock Quotes and apply the following formatting - Apply AcomThemed Cell Style format to the 12 D2 and B&C Apply Top and Bottom Borders to the ages and 2 D2 - Apply Thick Bottom Border to the range 36 7 9 Create a footer with your name on the theme of the worldhet in the middle and the the name on the nohtside 10 Save and do the workbook Submit these added Total Points Type here to search i Lenovo Anal TU Styles Editing site A RASI Paragraph Font aboard Styles Caderns EX16_XL_CH08_GRADER_ML1_HW - Investment Banking 1 Project Description: You are an investment Banker and you would to put together a brief statistical report of the most viewed sto the day. To complete this task, you will enter stock prices and create a report using the Analysis Talpak Steps to Perform: Step Instructions 1 2 Start Excel Open exploring_608_grader_mf_Shoes Type Symbol in cel B2 Type Last Salt Price in calc2 and type Rank in cel D2 Enter the following stock information beginning in cell 3 Click cell B3 and type CTIC Cack cel c3 and type 1.92. Click el B4 andype AAPL Click cell CA and type 130.36. Click cel BS and type C Click cel C5 and type 50.19. Ole and type BAC. Click cell C6 and type 18.12 3 5 6 Use the RANK.AVG function to calculate the rank of the first stock incel and copy the formula down to complete the column Click col 88, type Average value, and incl be 100. In cel 89, use the AVERAGEIF function to calculate the average value of toda atsed for less than $10000 using the criteria in colla Set column width to 13 column to 22. andy Accounting number format to code Create a Descriptive Statistics Summary reporting the range C2.5 as the input range and F2 as the output range. Note that the first row of the input range contains labels Rename the worksheet Stock Quotes and apply the following formatting - Apply AcomThemed Cell Style format to the 12 D2 and B&C Apply Top and Bottom Borders to the ages and 2 D2 - Apply Thick Bottom Border to the range 36 7 9 Create a footer with your name on the theme of the worldhet in the middle and the the name on the nohtside 10 Save and do the workbook Submit these added Total Points Type here to search i Lenovo


