Answered step by step
Verified Expert Solution
Question
1 Approved Answer
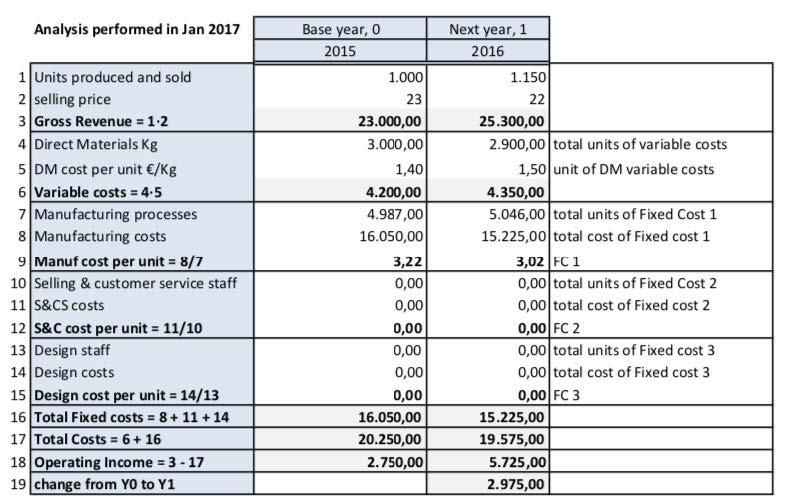
Analyse the differences between year 2015 and 2016, through a strategic analysis of the operating income, finding its components: growth component, the price recovery component

Analyse the differences between year 2015 and 2016, through a strategic analysis of the operating income, finding its components: growth component, the price recovery component and the productivity component
Analysis performed in Jan 2017 1 Units produced and sold 2 selling price 3 Gross Revenue = 1.2 4 Direct Materials Kg 5 DM cost per unit /kg 6 Variable costs = 4.5 7 Manufacturing processes 8 Manufacturing costs 9 Manuf cost per unit = 8/7 10 Selling & customer service staff 11 S&CS costs 12 S&C cost per unit = 11/10 13 Design staff 14 Design costs 15 Design cost per unit = 14/13 16 Total Fixed costs = 8 + 11 + 14 17 Total Costs = 6 + 16 H 18 Operating Income = 3-17 19 change from YO to Y1 Base year, 0 2015 1.000 23 23.000,00 3.000,00 1,40 4.200,00 4.987,00 16.050,00 3,22 0,00 0,00 0,00 0,00 0,00 0,00 16.050,00 20.250,00 2.750,00 Next year, 1 2016 1.150 22 25.300,00 2.900,00 total units of variable costs 1,50 unit of DM variable costs 4.350,00 5.046,00 total units of Fixed Cost 1 15.225,00 total cost of Fixed cost 1 3,02 FC 1 0,00 total units of Fixed Cost 2 0,00 total cost of Fixed cost 2 0,00 FC 2 0,00 total units of Fixed cost 3 0,00 total cost of Fixed cost 3 0,00 FC 3 15.225,00 19.575,00 5.725,00 2.975,00Step by Step Solution
There are 3 Steps involved in it
Step: 1

Get Instant Access to Expert-Tailored Solutions
See step-by-step solutions with expert insights and AI powered tools for academic success
Step: 2

Step: 3

Ace Your Homework with AI
Get the answers you need in no time with our AI-driven, step-by-step assistance
Get Started


