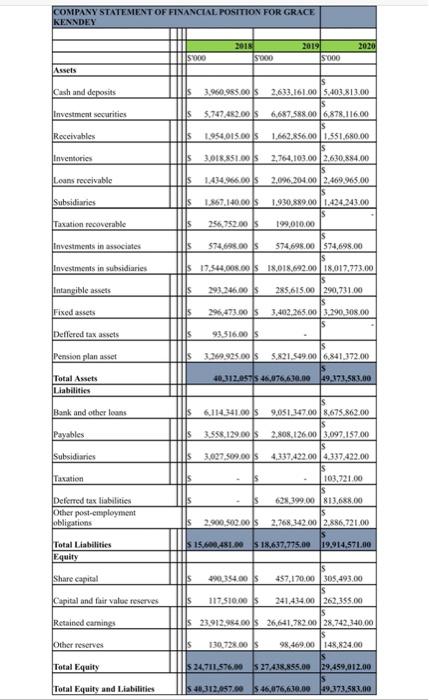
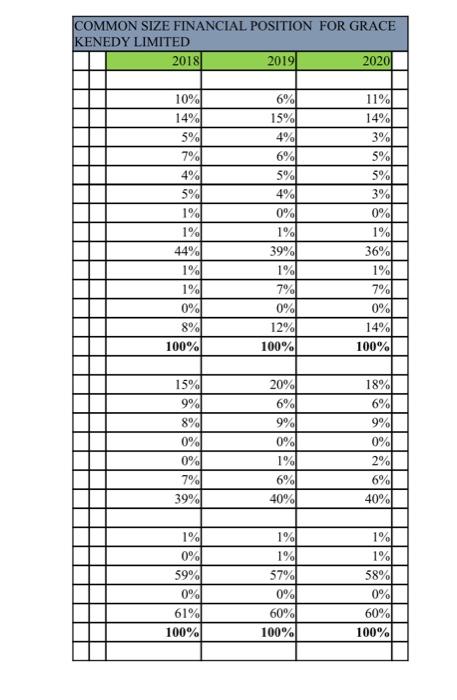
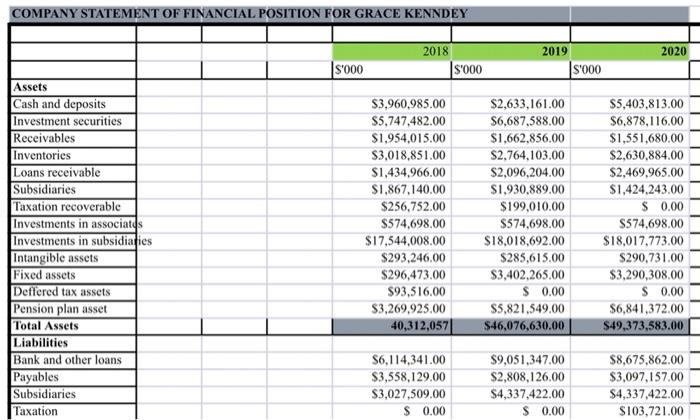
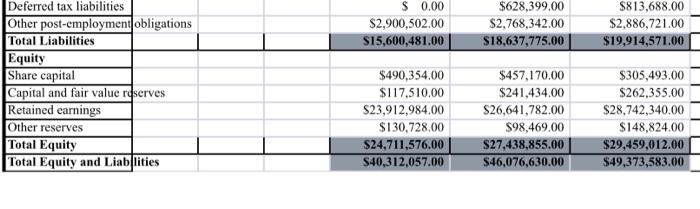
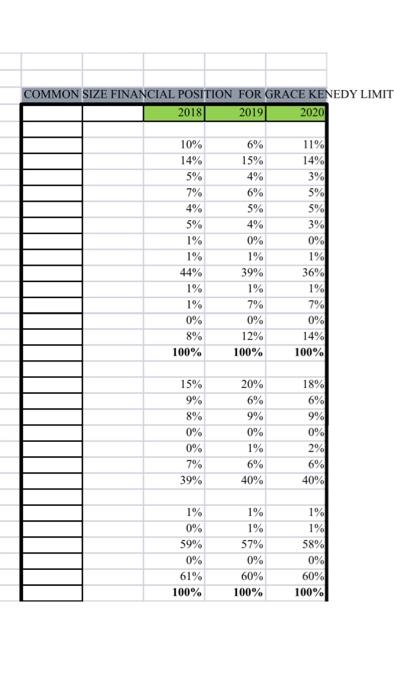
Analyse the performance of the company in terms of the common sized financial statements for the period 2018- 2019
COMPANY STATEMENT OF FINANCIAL POSTTTON FOR GRACE KENNDEY 2020 2015 S000 2019 S000 S000 Assets Cash and deposits Investment securities Receivables Is 3.960.985.00 52.633.161.00 5.403.813.00 IS Is 5.747,483.00 6.687,588.00 6,878,116,00 s 1.954.015.00 1.662.856.00 1.551.680.00 Ils 3.018,851.00 2,764,103.00 2.630,884.00 Ils 1.434.966.00 52.096,204.00 2.469 965.00 IS Is 1.867.140.00 1.930.889.00 1.424.243.00 Inventories Loans receivable Subsidiaries Taxation recoverable 15 256.752.00 199,000.00 Investments in associates IS 574.698.00 574.698.00 574,698.00 Investments in subsidiaries Is 19.544,000.00 18.018.692.00 18,017.773.00 Intangible assets 293.246.00 285.615.00 290,731.00 Fixed assets 15 29 473.003,402,265.00 3.290.308.00 Deffered tax assets 93.316.00 Pension plan asset 39.925.00 5.821.549.006.841.372.00 40.312.0575 46.076.630.0049.373.583.00 Total Assets Liabilities Bank and other loans Payables 6.114341.009.051.347.00 8.675.862.00 Is 3.558.129.00 $ 2.808.126.00 3.097.157.00 Is 3.627.509.00 4,337,432,00 4.337.422.00 Is 103.721.00 Subsidiaries Taxation s 628.399.00 $13.688.00 Deferred tax liabilities Other post-employment obligations s 2.900 2.00 2.768 342.00 2.886,721.00 S 15.600.481.00 18.637,775.00 19.914.571.00 Total Liabilities Equity Share capital Capital and fair value reserves Retained carnings Is 9035400 457,170.00 305,493.00 IS 117,310.00 241.434,00 262,355.00 Is is 23912.954.00 26,641.782.00 28.742,340.00 Other reserves 130,728.00 98.469.00 148.824.00 Total Equity 5 24.711.576.00 27.438.855.00 29,459,012.00 is $ 46,312.057.00 $ 46,076,630,00 19.373.581.00 Total Equity and Liabilities COMMON SIZE FINANCIAL POSITION FOR GRACE KENEDY LIMITED 2018 20191 20201 10% 14% 6% 15% 4% 6% 5% 79 4% 5% 1% 1% 44% 1% 1% 0% 8% 100% 5% 4% 0% 1% 39% 11% 14% 3% 5% 5% 3% 0% 1% 36% 1% 1% 7% 0% 7% 0% 14% 100% 12% 100% 15% 9% 20% 6% 8% 9% 0% 0% 7% 39% 0% 1% 6% 40% 18% 6% 9% 0% 2% 6% 40% 1% 0% 59% 0% 61% 100% 1% 1% 57% 0% 60% 100% 1% 1% 58% 0% 60% 100% COMPANY STATEMENT OF FINANCIAL POSITION FOR GRACE KENNDEY 2020 2018 S'000 2019 S'000 S'000 Assets Cash and deposits Investment securities Receivables Inventories Loans receivable Subsidiaries Taxation recoverable Investments in associates Investments in subsidiaries Intangible assets Fixed assets Deffered tax assets Pension plan asset Total Assets Liabilities Bank and other loans Payables Subsidiaries Taxation $3.960,985.00 $5,747,482.00 $1.954.015.00 $3,018,851.00 $1,434,966,00 $1,867,140.00 $256,752.00 $574,698.00 $17.544,008.00 $293.246,00 $296,473.00 $93,516,00 $3,269,925.00 40,312,057 $2,633,161.00 $6,687,588.00 $1,662,856,00 $2,764,103.00 $2,096,204.00 $1,930.889.00 $199,010,00 $574,698.00 $18,018,692.00 $285,615.00 $3,402,265.00 $ 0.00 $5.821.549,00 $46,076,630.00 $5,403,813.00 $6,878,116.00 $1,551,680.00 $2,630,884.00 $2,469,965.00 $1,424,243.00 $ 0.00 $574,698.00 $18,017,773.00 $290,731.00 $3,290,308,00 $ 0.00 $6,841,372.00 S49,373,583.00 56,114,341.00 $3,558,129.00 $3,027,509.00 $ 0.00 $9,051,347.00 $2,808,126.00 $4,337,422.00 $ 0.00 $8,675,862.00 $3,097,157,00 $4,337,422.00 S103,721.00 $ 0.00 $2,900,502.00 S15,600,481.00 $628,399.00 $2,768,342.00 $18,637,775.00 $813,688.00 $2,886,721.00 $19,914,571.00 Deferred tax liabilities Other post-employment obligations Total Liabilities Equity Share capital Capital and fair value reserves Retained earnings Other reserves Total Equity Total Equity and Liablities $490,354,00 $117.510.00 $23,912,984.00 $130,728.00 $24,711,576.00 $40,312.057.00 $457,170.00 $241,434.00 S26,641,782.00 $98,469,00 S27,438.855.00 $46,076,630.00 $305,493.00 $262,355.00 $28,742,340.00 $148,824.00 $29,459,012.00 $49,373,583.00 COMMON SIZE FINANCIAL POSITION FOR GRACE KENEDY LIMIT 2018 2019 2020 10% 14% 5% 7% 4% 5% 1% 1% 44% 1% 1% 0% 8% 100% 6% 15% 4% 6% 5% 4% 0% 1% 39% 1% 7% 0% 12% 100% 11% 14% 3% 5% 5% 3% 0% 1% 36% 1% 79% 0% 14% 100% 15% 9% 8% 0% 0% 7% 39% 20% 6% 9% 0% 1% 6% 40% 18% 6% 9% 0% 29 6% 40% 1% 1% 0% 59% 0% 61% 100% 1% 57% 0% 1% 1% 58% 0 60% 100% 60% 100% COMPANY STATEMENT OF FINANCIAL POSTTTON FOR GRACE KENNDEY 2020 2015 S000 2019 S000 S000 Assets Cash and deposits Investment securities Receivables Is 3.960.985.00 52.633.161.00 5.403.813.00 IS Is 5.747,483.00 6.687,588.00 6,878,116,00 s 1.954.015.00 1.662.856.00 1.551.680.00 Ils 3.018,851.00 2,764,103.00 2.630,884.00 Ils 1.434.966.00 52.096,204.00 2.469 965.00 IS Is 1.867.140.00 1.930.889.00 1.424.243.00 Inventories Loans receivable Subsidiaries Taxation recoverable 15 256.752.00 199,000.00 Investments in associates IS 574.698.00 574.698.00 574,698.00 Investments in subsidiaries Is 19.544,000.00 18.018.692.00 18,017.773.00 Intangible assets 293.246.00 285.615.00 290,731.00 Fixed assets 15 29 473.003,402,265.00 3.290.308.00 Deffered tax assets 93.316.00 Pension plan asset 39.925.00 5.821.549.006.841.372.00 40.312.0575 46.076.630.0049.373.583.00 Total Assets Liabilities Bank and other loans Payables 6.114341.009.051.347.00 8.675.862.00 Is 3.558.129.00 $ 2.808.126.00 3.097.157.00 Is 3.627.509.00 4,337,432,00 4.337.422.00 Is 103.721.00 Subsidiaries Taxation s 628.399.00 $13.688.00 Deferred tax liabilities Other post-employment obligations s 2.900 2.00 2.768 342.00 2.886,721.00 S 15.600.481.00 18.637,775.00 19.914.571.00 Total Liabilities Equity Share capital Capital and fair value reserves Retained carnings Is 9035400 457,170.00 305,493.00 IS 117,310.00 241.434,00 262,355.00 Is is 23912.954.00 26,641.782.00 28.742,340.00 Other reserves 130,728.00 98.469.00 148.824.00 Total Equity 5 24.711.576.00 27.438.855.00 29,459,012.00 is $ 46,312.057.00 $ 46,076,630,00 19.373.581.00 Total Equity and Liabilities COMMON SIZE FINANCIAL POSITION FOR GRACE KENEDY LIMITED 2018 20191 20201 10% 14% 6% 15% 4% 6% 5% 79 4% 5% 1% 1% 44% 1% 1% 0% 8% 100% 5% 4% 0% 1% 39% 11% 14% 3% 5% 5% 3% 0% 1% 36% 1% 1% 7% 0% 7% 0% 14% 100% 12% 100% 15% 9% 20% 6% 8% 9% 0% 0% 7% 39% 0% 1% 6% 40% 18% 6% 9% 0% 2% 6% 40% 1% 0% 59% 0% 61% 100% 1% 1% 57% 0% 60% 100% 1% 1% 58% 0% 60% 100% COMPANY STATEMENT OF FINANCIAL POSITION FOR GRACE KENNDEY 2020 2018 S'000 2019 S'000 S'000 Assets Cash and deposits Investment securities Receivables Inventories Loans receivable Subsidiaries Taxation recoverable Investments in associates Investments in subsidiaries Intangible assets Fixed assets Deffered tax assets Pension plan asset Total Assets Liabilities Bank and other loans Payables Subsidiaries Taxation $3.960,985.00 $5,747,482.00 $1.954.015.00 $3,018,851.00 $1,434,966,00 $1,867,140.00 $256,752.00 $574,698.00 $17.544,008.00 $293.246,00 $296,473.00 $93,516,00 $3,269,925.00 40,312,057 $2,633,161.00 $6,687,588.00 $1,662,856,00 $2,764,103.00 $2,096,204.00 $1,930.889.00 $199,010,00 $574,698.00 $18,018,692.00 $285,615.00 $3,402,265.00 $ 0.00 $5.821.549,00 $46,076,630.00 $5,403,813.00 $6,878,116.00 $1,551,680.00 $2,630,884.00 $2,469,965.00 $1,424,243.00 $ 0.00 $574,698.00 $18,017,773.00 $290,731.00 $3,290,308,00 $ 0.00 $6,841,372.00 S49,373,583.00 56,114,341.00 $3,558,129.00 $3,027,509.00 $ 0.00 $9,051,347.00 $2,808,126.00 $4,337,422.00 $ 0.00 $8,675,862.00 $3,097,157,00 $4,337,422.00 S103,721.00 $ 0.00 $2,900,502.00 S15,600,481.00 $628,399.00 $2,768,342.00 $18,637,775.00 $813,688.00 $2,886,721.00 $19,914,571.00 Deferred tax liabilities Other post-employment obligations Total Liabilities Equity Share capital Capital and fair value reserves Retained earnings Other reserves Total Equity Total Equity and Liablities $490,354,00 $117.510.00 $23,912,984.00 $130,728.00 $24,711,576.00 $40,312.057.00 $457,170.00 $241,434.00 S26,641,782.00 $98,469,00 S27,438.855.00 $46,076,630.00 $305,493.00 $262,355.00 $28,742,340.00 $148,824.00 $29,459,012.00 $49,373,583.00 COMMON SIZE FINANCIAL POSITION FOR GRACE KENEDY LIMIT 2018 2019 2020 10% 14% 5% 7% 4% 5% 1% 1% 44% 1% 1% 0% 8% 100% 6% 15% 4% 6% 5% 4% 0% 1% 39% 1% 7% 0% 12% 100% 11% 14% 3% 5% 5% 3% 0% 1% 36% 1% 79% 0% 14% 100% 15% 9% 8% 0% 0% 7% 39% 20% 6% 9% 0% 1% 6% 40% 18% 6% 9% 0% 29 6% 40% 1% 1% 0% 59% 0% 61% 100% 1% 57% 0% 1% 1% 58% 0 60% 100% 60% 100%