

Answered step by step
Verified Expert Solution
Question
1 Approved Answer
Analyse the three most recent year common-size balance sheet of McDonald and indicate the following: ASSETS Current assets Cash and equivalents Accounts and notes receivable
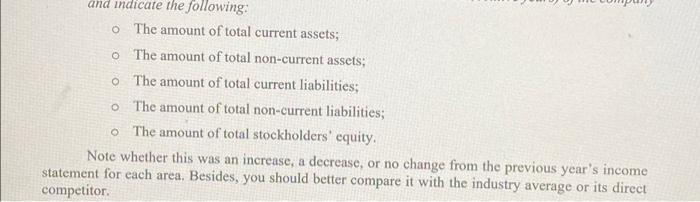
Analyse the three most recent year common-size balance sheet of McDonald and indicate the following: 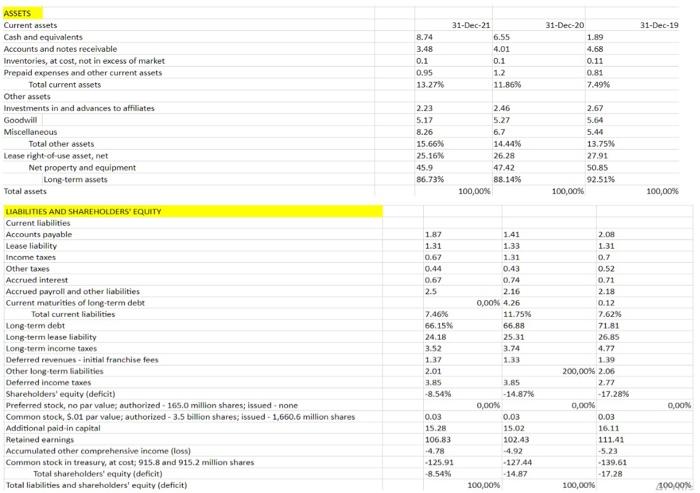
Step by Step Solution
There are 3 Steps involved in it
Step: 1

Get Instant Access to Expert-Tailored Solutions
See step-by-step solutions with expert insights and AI powered tools for academic success
Step: 2

Step: 3
Ace Your Homework with AI
Get the answers you need in no time with our AI-driven, step-by-step assistance
Get Started
The First Time Homebuyers Handbook
Authors: Dean Thompson
1st Edition
1658856112, 978-1658856119