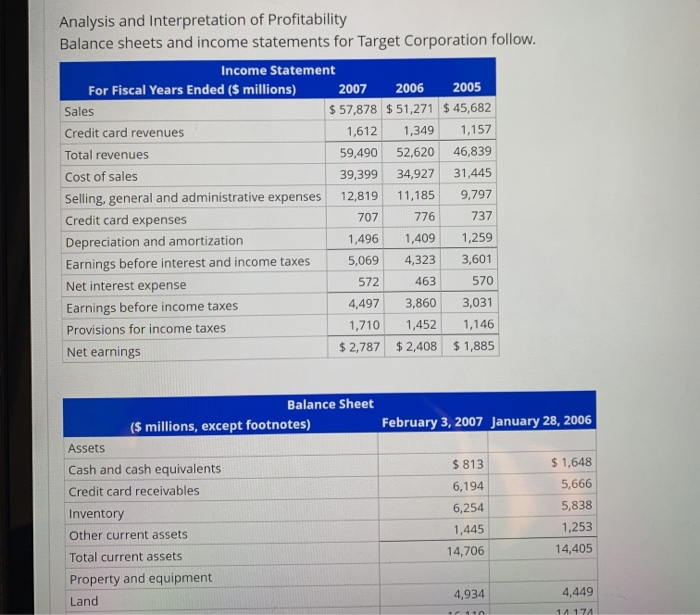
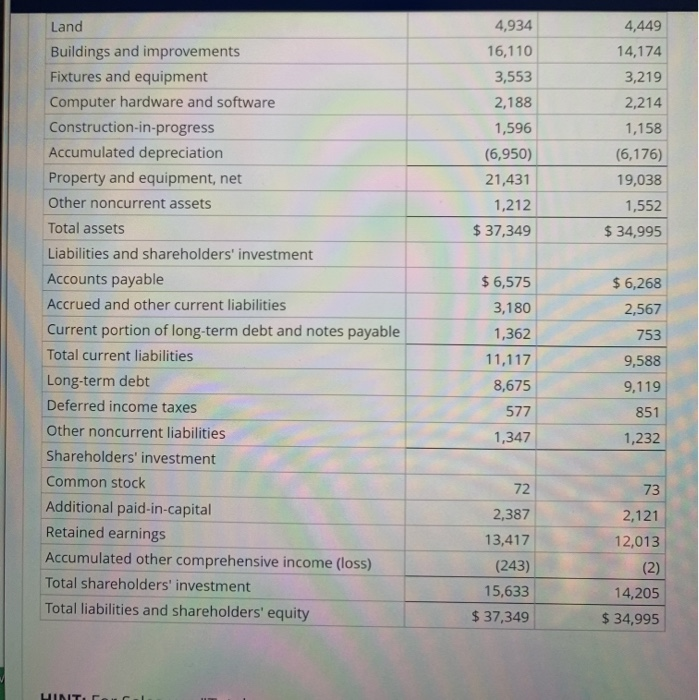
Analysis and Interpretation of Profitability Balance sheets and income statements for Target Corporation follow. Income Statement For Fiscal Years Ended ($ millions) 2007 2006 2005 Sales $ 57,878 $ 51,271 $ 45,682 Credit card revenues 1,612 1,349 1,157 Total revenues 59,490 52,620 46,839 Cost of sales 39,399 34,927 31,445 Selling, general and administrative expenses 12,819 11,185 9,797 Credit card expenses 707 776 737 Depreciation and amortization 1,496 1,409 1,259 Earnings before interest and income taxes 5,069 4,323 3,601 Net interest expense 572 463 570 Earnings before income taxes 4,497 3,860 3,031 Provisions for income taxes 1,710 1,452 1,146 Net earnings $ 2,787 $2,408 $1,885 February 3, 2007 January 28, 2006 $ 813 Balance Sheet ($ millions, except footnotes) Assets Cash and cash equivalents Credit card receivables Inventory Other current assets Total current assets Property and equipment Land 6,194 6,254 1,445 14,706 $ 1,648 5,666 5,838 1,253 14,405 4,934 4,449 4,934 16,110 3,553 2,188 1,596 (6,950) 21,431 1,212 $ 37,349 4,449 14,174 3,219 2,214 1,158 (6,176) 19,038 1,552 $ 34,995 Land Buildings and improvements Fixtures and equipment Computer hardware and software Construction-in-progress Accumulated depreciation Property and equipment, net Other noncurrent assets Total assets Liabilities and shareholders' investment Accounts payable Accrued and other current liabilities Current portion of long-term debt and notes payable Total current liabilities Long-term debt Deferred income taxes Other noncurrent liabilities Shareholders' investment Common stock Additional paid-in-capital Retained earnings Accumulated other comprehensive income (loss) Total shareholders' investment Total liabilities and shareholders' equity $ 6,575 3,180 1,362 11,117 8,675 577 1,347 $ 6,268 2,567 753 9,588 9,119 851 1,232 73 2,121 12,013 72 2,387 13,417 (243) 15,633 $ 37,349 (2) 14,205 $ 34,995 LINIT. (e) Compute return on equity (ROE) for 2007. (Round your answers to two decimal places. Do not round until your final answer.) 2007 ROE = 1.05 % % (f) Infer the nonoperating return component of ROE for 2007. (Use answers from above to calculate. Round your answer to two decimal places.) 2007 nonoperating return = O * %


