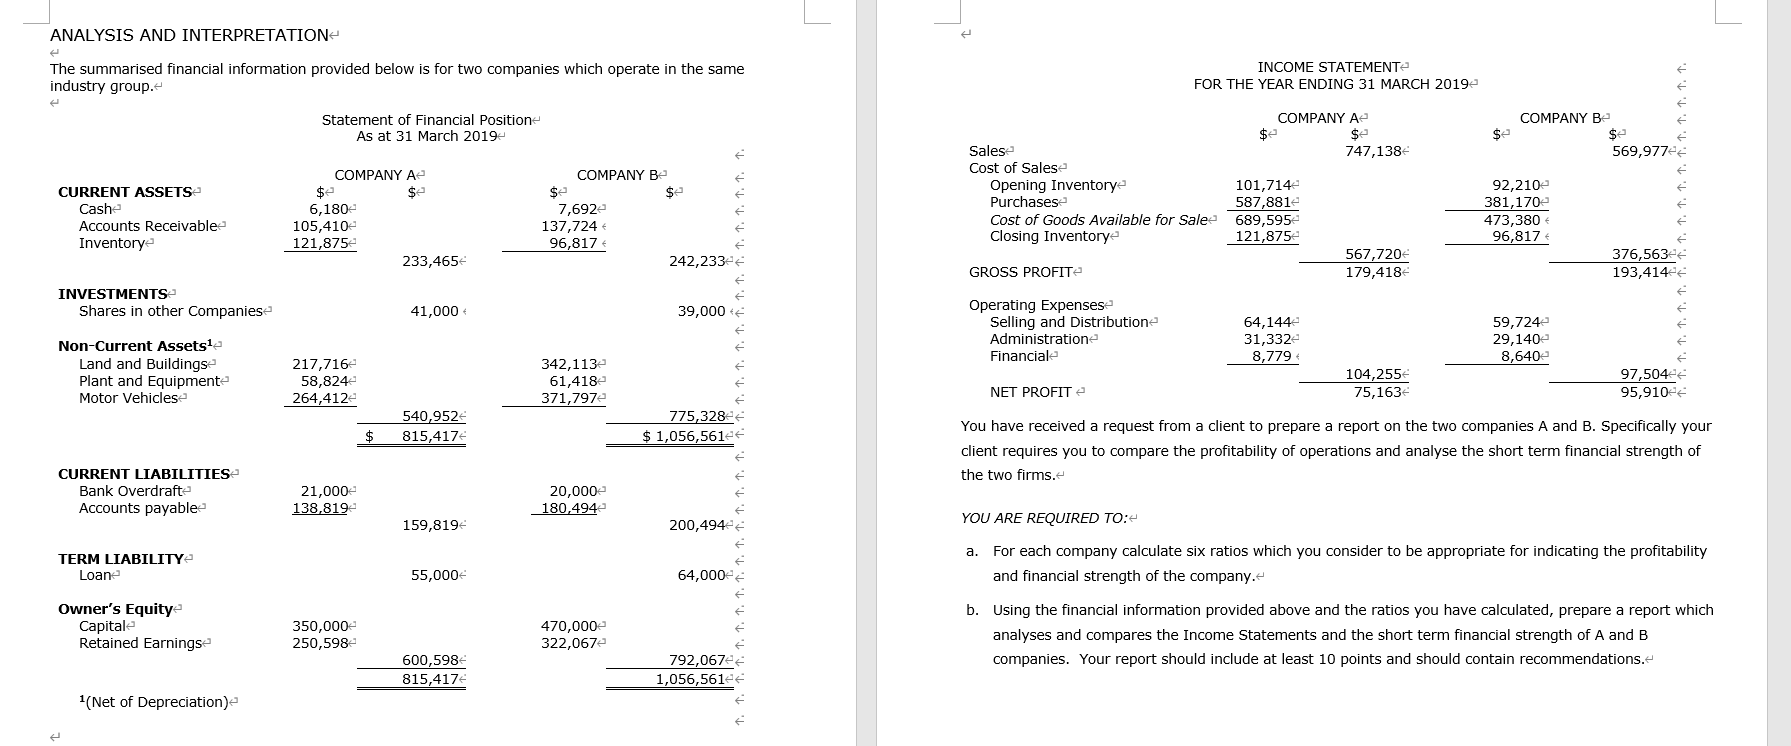
ANALYSIS AND INTERPRETATION The summarised financial information provided below is for two companies which operate in the same industry group. INCOME STATEMENTE FOR THE YEAR ENDING 31 MARCH 20192 COMPANY A Statement of Financial Position As at 31 March 2019 $ $e COMPANY Be $ 569,9774 1. 747,138 1.1.1.1.1.1.1.1.1.1.1.1. 1.1. CURRENT ASSETS Cashe Accounts Receivable Inventory COMPANY A $e 6,180 105,4102 121,8752 233,465 Salese Cost of Salese Opening Inventory Purchasese Cost of Goods Available for Sale Closing Inventory COMPANY Be $e $e 7,692 137,724 96,817 242,233 1.1. 101,714 587,8812 689,5952 121,875 92,2102 381,1702 473,380 96,817 1.1. GROSS PROFIT 567,720 179,418 376,563 193,414 INVESTMENTS Shares in other Companiese 41,000 39,000 1.1.1.1.1. Operating Expenses Selling and Distribution- Administratione Financiale 64,144 31,3322 8,779 59,7242 29,140 8,6402 1.1.1.1.1. Non-Current Assetsla Land and Buildings Plant and Equipmente Motor Vehicles 217,716 58,824 264,4122 342,1132 61,4182 371,7972 1.1.1.1.1. NET PROFIT e 104,255 75,163 97,504 95,9104 540,952 815,417 775,328 $ 1,056,561 $ You have received a request from a client to prepare a report on the two companies A and B. Specifically your client requires you to compare the profitability of operations and analyse the short term financial strength of the two firms. 1. 1. CURRENT LIABILITIES Bank Overdrafte Accounts payable 1. 21,000 138,819 20,000 180,494 1. 159,819 200,494- YOU ARE REQUIRED TO:- 1.1. TERM LIABILITY Loane a. For each company calculate six ratios which you consider to be appropriate for indicating the profitability and financial strength of the company. 55,000 64,000 1.1.1.1.1. Owner's Equity Capitale Retained Earningse 350,000 250,598 470,000 322,067e b. Using the financial information provided above and the ratios you have calculated, prepare a report which analyses and compares the Income Statements and the short term financial strength of A and B companies. Your report should include at least 10 points and should contain recommendations. 1. 1. 600,598 815,417 792,067 1,056,5612 1. 1. (Net of Depreciation) 1. ANALYSIS AND INTERPRETATION The summarised financial information provided below is for two companies which operate in the same industry group. INCOME STATEMENTE FOR THE YEAR ENDING 31 MARCH 20192 COMPANY A Statement of Financial Position As at 31 March 2019 $ $e COMPANY Be $ 569,9774 1. 747,138 1.1.1.1.1.1.1.1.1.1.1.1. 1.1. CURRENT ASSETS Cashe Accounts Receivable Inventory COMPANY A $e 6,180 105,4102 121,8752 233,465 Salese Cost of Salese Opening Inventory Purchasese Cost of Goods Available for Sale Closing Inventory COMPANY Be $e $e 7,692 137,724 96,817 242,233 1.1. 101,714 587,8812 689,5952 121,875 92,2102 381,1702 473,380 96,817 1.1. GROSS PROFIT 567,720 179,418 376,563 193,414 INVESTMENTS Shares in other Companiese 41,000 39,000 1.1.1.1.1. Operating Expenses Selling and Distribution- Administratione Financiale 64,144 31,3322 8,779 59,7242 29,140 8,6402 1.1.1.1.1. Non-Current Assetsla Land and Buildings Plant and Equipmente Motor Vehicles 217,716 58,824 264,4122 342,1132 61,4182 371,7972 1.1.1.1.1. NET PROFIT e 104,255 75,163 97,504 95,9104 540,952 815,417 775,328 $ 1,056,561 $ You have received a request from a client to prepare a report on the two companies A and B. Specifically your client requires you to compare the profitability of operations and analyse the short term financial strength of the two firms. 1. 1. CURRENT LIABILITIES Bank Overdrafte Accounts payable 1. 21,000 138,819 20,000 180,494 1. 159,819 200,494- YOU ARE REQUIRED TO:- 1.1. TERM LIABILITY Loane a. For each company calculate six ratios which you consider to be appropriate for indicating the profitability and financial strength of the company. 55,000 64,000 1.1.1.1.1. Owner's Equity Capitale Retained Earningse 350,000 250,598 470,000 322,067e b. Using the financial information provided above and the ratios you have calculated, prepare a report which analyses and compares the Income Statements and the short term financial strength of A and B companies. Your report should include at least 10 points and should contain recommendations. 1. 1. 600,598 815,417 792,067 1,056,5612 1. 1. (Net of Depreciation) 1