Answered step by step
Verified Expert Solution
Question
1 Approved Answer
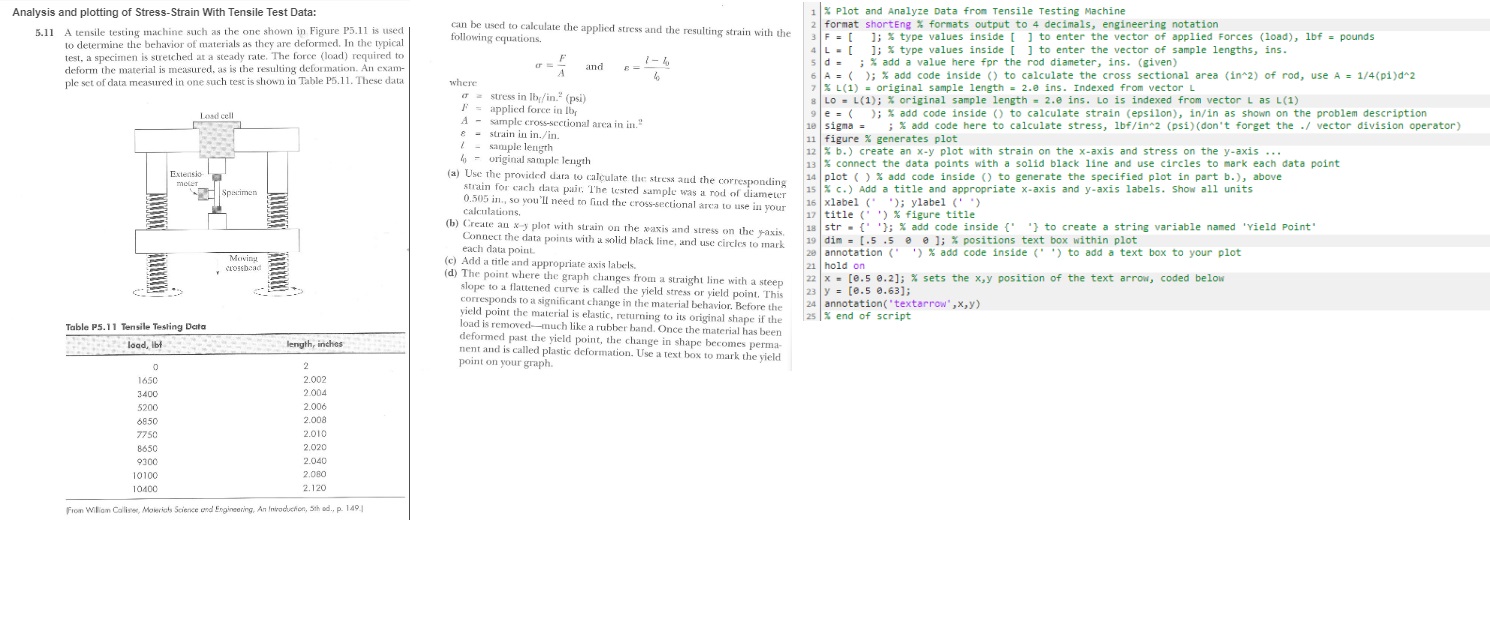
Analysis and plotting of Stress - Strain With Tensile Test Data: 5 . 1 1 A tensile testing machine such as the one shown in
Analysis and plotting of StressStrain With Tensile Test Data:
A tensile testing machine such as the one shown in Figure P is used
to determine the behavior of materials as they are deformed. In the typical
test, a specimen is suretched at a steady rate. The force load required to
deform the material is measured, as is the resulting detormation. An cxam
Table P Tensile Tesling Dato
can be used to calculate the applied stress and the resulting strain with the
following equations.
and
where
suress in psi
A simple crosssectional area in in
stain in inin
sample length
a Use the provided data to calculate the stress aud the corresponding
statin for cach data pair, The tested sample was a rod of diameter
in so you'll need on find the crosssectional arca to use in your
Calculations.
b Create an y plot with strain on the waxis and stress on the yaxis
Connect the data points with a solid black line, and use circles to mark
each data point
c Add a title and appropriate axis labels
d The point where the graph changes from a straight line with a steep
slope to a flattened curve is called the yield stress or yield point. This
corresponds to at significant change in the material behavior. Before the
yeld point the material is elastic, returning to its original shape if the
load is removedmuch like a rubber band. Once the material has been
nent and is called plastic deformation. Use a text box to mark the vield
point on your graph.
Plot and Analyze Data from Tensile Testing Machine
format shorteng formats output to decimals, engineering notation
type values inside to enter the vector of applied Forces oad bf pounds
; type values inside to enter the vector of sample lengths, ins.
; add a value here fpr the rod diameter, ins. given
; add code inside to calculate the cross sectional area in of rod, use
original sample length ins. Indexed from vector
; original sample length ins. Lo is indexed from vector as
; add code inside to calculate strain epsilon inin as shown on the problem description
sigma ; add code here to calculate stress, lbfinpsidont forget the vector division operator
figure generates plot
b create an plot with strain on the axis and stress on the axis
connect the data points with a solid black line and use circles to mark each data point
plot add code inside to generate the specified plot in part b above
c Add a title and appropriate axis and axis labels. Show all units
xlabel ; ylabel
title figure title
str ; add code inside to create a string variable named 'Yield point"
dim e

Step by Step Solution
There are 3 Steps involved in it
Step: 1

Get Instant Access to Expert-Tailored Solutions
See step-by-step solutions with expert insights and AI powered tools for academic success
Step: 2

Step: 3

Ace Your Homework with AI
Get the answers you need in no time with our AI-driven, step-by-step assistance
Get Started


