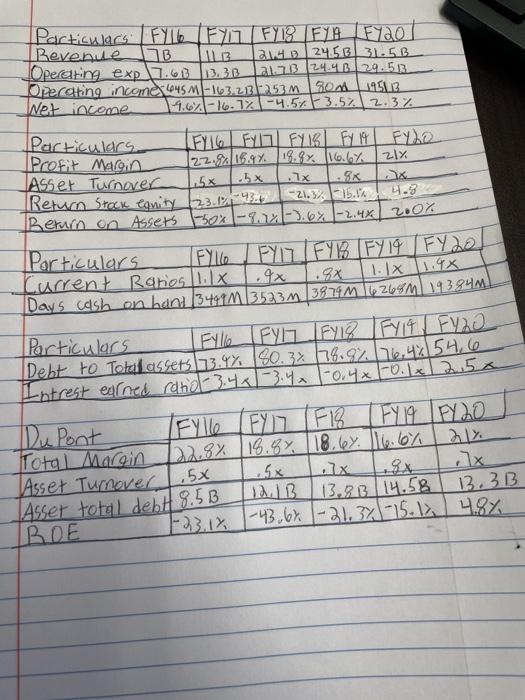
Analysis for Tesla, I need with 1. Five year net sales, operating expenses, operating income Balance Sheet and net income analysis. Once calculations are complete, interpret the resulting data and comment on the significance of the trend results. 2. Five year total profit margin, asset turnover, return on assets and return on stockholder equity analysis. Once calculations are complete, interpret the resulting data and evaluate the company's profitability. 3. Five year return on assets ratio, return on equity, management efficiency ratios, current ratio, days cash on hand and working capital analysis. Once calculations are complete, interpret the resulting data and evaluate the company's liquidity. 4. Five year debt ratio & times interest earned ratio analysis. Once calculations are complete, interpret the resulting data and comment on the company's long term solvency. 5. Complete a Du Pont Analysis for each of the five most recent years. Once calculations are complete, interpret the resulting data and comment on the company's individual Du Pont characteristics (e.g., Total Margin, Total Asset Turnover & Equity Multiplier) and trends across the analysis period. 6. What is the name of the company's independent auditors? What type of opinion did the independent auditors issue on the financial statements (unqualified, qualified, adverse or disclaimer)? What does this opinion mean? Particulacs FYTOFFY13 FYRFyao Revenue B AL13 a124.5 31.5 B Operating exp\].6 13.3B al.3 24.4129.513 Operating income 445M-103.23 253 M 1800 1951.13 Net income -1.6.-16.12 -4.5-3.5% 2.3% Particulars IFYIFYI FY16) 6714 FYLO Profit Marcin 122.5 16.9%. 19.9. 16.1% 217 Asset Turnover 5x 5x .x ex 41.8 Return Stock Canity 23.12-436 -21.3% - 15.10. Return on Assets F50x1-9. 221-3.6% -2.4x 200% Particulars FYlice FYZI FYR FY 19 FY20. Current Ratios 1.18 Days cash on hand 34,9m 13523m 3879m 6268M 1938411 Particulars File Fyn F12 F119FV22 Debt to Total assets 173.4%, 80.3% 78.8% 76.4% 54,6 Intrest earned ratio-3.4x-3.4.1-0.4-0. 1x25x Dupont Fylle (FY) F 18 TFY19 FY20 Total Marein 122.8% 18.8%. 18.67. 16.6% Asset Turnover 1.5x B 13.30 14.58 ROE F23.1x 1-43.6x -21.3% -15.124.8% 13.3B Asser total debtl 8.53 Analysis for Tesla, I need with 1. Five year net sales, operating expenses, operating income Balance Sheet and net income analysis. Once calculations are complete, interpret the resulting data and comment on the significance of the trend results. 2. Five year total profit margin, asset turnover, return on assets and return on stockholder equity analysis. Once calculations are complete, interpret the resulting data and evaluate the company's profitability. 3. Five year return on assets ratio, return on equity, management efficiency ratios, current ratio, days cash on hand and working capital analysis. Once calculations are complete, interpret the resulting data and evaluate the company's liquidity. 4. Five year debt ratio & times interest earned ratio analysis. Once calculations are complete, interpret the resulting data and comment on the company's long term solvency. 5. Complete a Du Pont Analysis for each of the five most recent years. Once calculations are complete, interpret the resulting data and comment on the company's individual Du Pont characteristics (e.g., Total Margin, Total Asset Turnover & Equity Multiplier) and trends across the analysis period. 6. What is the name of the company's independent auditors? What type of opinion did the independent auditors issue on the financial statements (unqualified, qualified, adverse or disclaimer)? What does this opinion mean? Particulacs FYTOFFY13 FYRFyao Revenue B AL13 a124.5 31.5 B Operating exp\].6 13.3B al.3 24.4129.513 Operating income 445M-103.23 253 M 1800 1951.13 Net income -1.6.-16.12 -4.5-3.5% 2.3% Particulars IFYIFYI FY16) 6714 FYLO Profit Marcin 122.5 16.9%. 19.9. 16.1% 217 Asset Turnover 5x 5x .x ex 41.8 Return Stock Canity 23.12-436 -21.3% - 15.10. Return on Assets F50x1-9. 221-3.6% -2.4x 200% Particulars FYlice FYZI FYR FY 19 FY20. Current Ratios 1.18 Days cash on hand 34,9m 13523m 3879m 6268M 1938411 Particulars File Fyn F12 F119FV22 Debt to Total assets 173.4%, 80.3% 78.8% 76.4% 54,6 Intrest earned ratio-3.4x-3.4.1-0.4-0. 1x25x Dupont Fylle (FY) F 18 TFY19 FY20 Total Marein 122.8% 18.8%. 18.67. 16.6% Asset Turnover 1.5x B 13.30 14.58 ROE F23.1x 1-43.6x -21.3% -15.124.8% 13.3B Asser total debtl 8.53