

Answered step by step
Verified Expert Solution
Question
1 Approved Answer
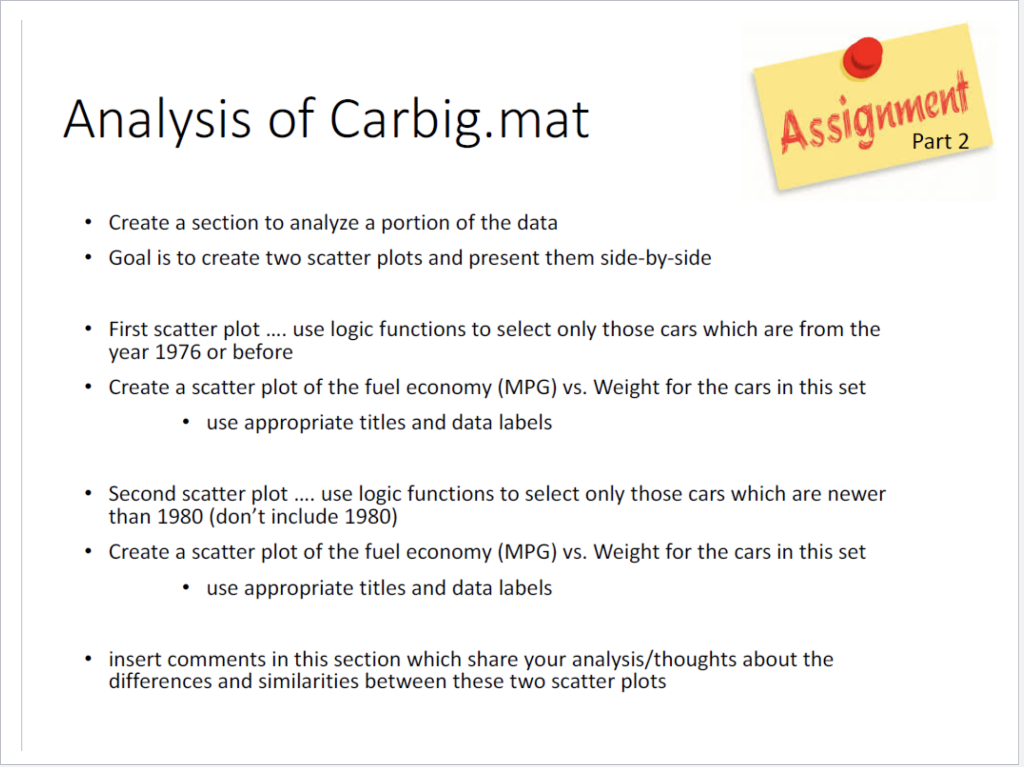
Analysis of Carbig.mat Assignment Part 2 Create a section to analyze a portion of the data Goal is to create two scatter plots and present
Step by Step Solution
There are 3 Steps involved in it
Step: 1

Get Instant Access to Expert-Tailored Solutions
See step-by-step solutions with expert insights and AI powered tools for academic success
Step: 2

Step: 3
Ace Your Homework with AI
Get the answers you need in no time with our AI-driven, step-by-step assistance
Get Started
Advanced Data Management For Sql Nosql Cloud And Distributed Databases
Authors: Lena Wiese
1st Edition
9783110441406