

Answered step by step
Verified Expert Solution
Question
1 Approved Answer
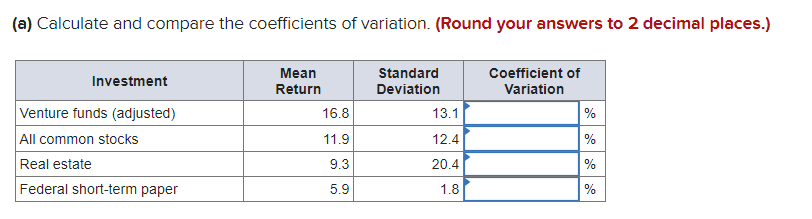
Analysis of investment portfolio returns over a 2 0 - year period showed the statistics below. ( a ) Calculate and compare the coefficients of
Analysis of investment portfolio returns over a year period showed the statistics below.
a Calculate and compare the coefficients of variation. Round your answers to decimal places.
See attached chart.
b Why would we use a coefficient of variation, and why not just compare the standard deviations?
multiple choice
The standard deviations are relative and not absolute measures of dispersion.
The standard deviations are an "absolute", not relative, measure of dispersion. It is best to use the CV when comparing across variables that have different means.
Standard deviation can only be compared when the variables have different units of measure.
c What do the data tell you about risk and return at that time period?
multiple choice choose
Federal shortterm paper has the lowest standard deviation and hence the greatest risk; real estate, the lowest risk.
Venture funds have greater risk and lower return than common stocks based on the CV
Venture funds have lower risk and greater return than common stocks based on the CV
Federal shortterm paper has the lowest CV and hence the greatest risk; real estate, the lowest risk.
Step by Step Solution
There are 3 Steps involved in it
Step: 1

Get Instant Access to Expert-Tailored Solutions
See step-by-step solutions with expert insights and AI powered tools for academic success
Step: 2

Step: 3
Ace Your Homework with AI
Get the answers you need in no time with our AI-driven, step-by-step assistance
Get Started
Finance And Strategy
Authors: Belen Villalonga
1st Edition
1783504935, 978-1783504930