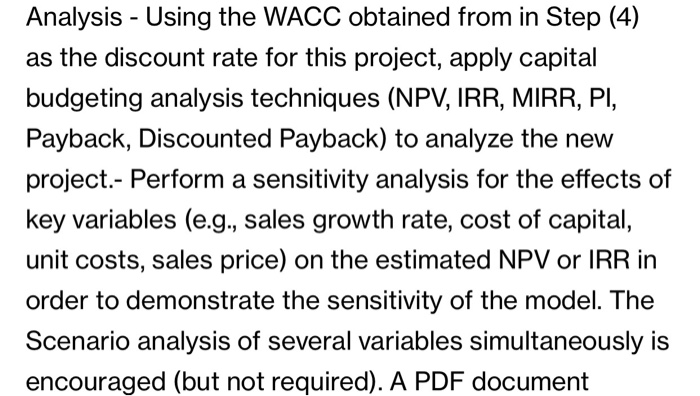
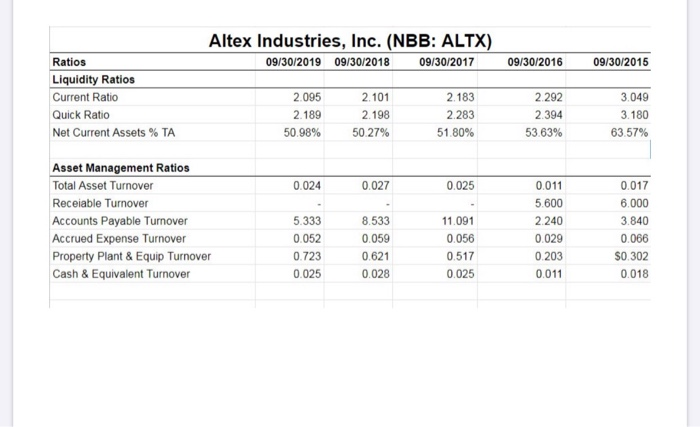
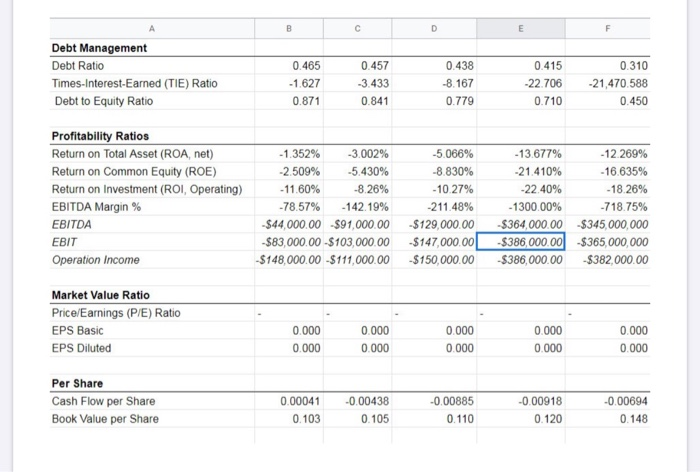
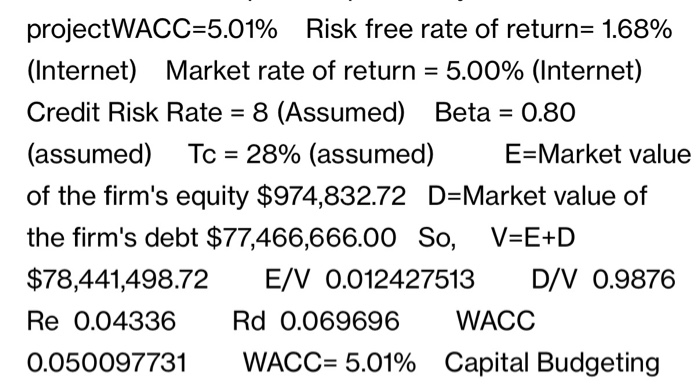
Analysis - Using the WACC obtained from in Step (4) as the discount rate for this project, apply capital budgeting analysis techniques (NPV, IRR, MIRR, PI, Payback, Discounted Payback) to analyze the new project.- Perform a sensitivity analysis for the effects of key variables (e.g., sales growth rate, cost of capital, unit costs, sales price) on the estimated NPV or IRR in order to demonstrate the sensitivity of the model. The Scenario analysis of several variables simultaneously is encouraged (but not required). A PDF document Altex Industries, Inc. (NBB: ALTX) 09/30/2019 09/30/2018 09/30/2017 09/30/2016 09/30/2015 Ratios Liquidity Ratios Current Ratio Quick Ratio Net Current Assets % TA 20 2 183 2292 2.095 2.189 50.98% 2.101 2.198 50.27% 2.283 51.80% 2.394 53.63% 3.049 3.180 63.57% 0.024 0.027 0.025 Asset Management Ratios Total Asset Turnover Receiable Turnover Accounts Payable Turnover Accrued Expense Turnover Property Plant & Equip Turnover Cash & Equivalent Turnover 5.333 0.052 0.723 0.025 8.533 0.059 0.621 0.028 11.091 0.056 0.517 0.025 0.011 5.600 2.240 0.029 0.203 0.011 0.017 6.000 3.840 0.066 $0.302 0.018 Debt Management Debt Ratio Times-interest-Earned (TIE) Ratio Debt to Equity Ratio 0.465 -1.627 0.871 0.457 -3.433 0.841 0.438 -8.167 0.779 0.415 -22.706 0.710 0.310 -21,470.588 0.450 Profitability Ratios Return on Total Asset (ROA, net) Return on Common Equity (ROE) Return on Investment (ROI, Operating) EBITDA Margin % EBITDA EBIT Operation Income -1.352% -3.002% -2.509% -5.430% - 11.60% -8.26% -78.57% -142.19% -$44,000.00 $91,000.00 -$83,000.00 -S103,000.00 -$148,000.00 -$111,000.00 -5.066% -8.830% - 10.27% -211.48% $129,000.00 $147,000.00 $150,000.00 -13.677% -21.410% -22.40% - 1300.00% $364,000.00 -$386,000.00 $386,000.00 - 12.269% - 16.635% -18.26% -718.75% $345,000,000 -$365,000,000 $382,000.00 Market Value Ratio Price/Earnings (P/E) Ratio EPS Basic EPS Diluted 0.000 0.000 0.000 0.000 0.000 0.000 0.000 0.000 0.000 0.000 205 Per Share Cash Flow per Share Book Value per Share 0.00041 0.103 -0.00438 0 .105 -0.00885 0.110 -0.00918 0.120 -0.00694 0.148 Altex Industries, Inc. (NBB: ALTX) 09/30/2019 09/30/2018 09/30/2017 09/30/2016 09/30/2015 Ratios Liquidity Ratios Current Ratio Quick Ratio Net Current Assets % TA 2.095 2.189 50.98% 2.101 2.198 50.27% 2.183 2.283 51.80% 2.292 2.394 53.63% 3.049 3.180 63.57% 0.024 0.027 0.025 Asset Management Ratios Total Asset Turnover Receiable Turnover Accounts Payable Turnover Accrued Expense Turnover Property Plant & Equip Turnover Cash & Equivalent Turnover 5.333 0.052 0.723 0.025 8.533 0.059 0.621 0.028 11.091 0.056 0.517 0.011 5.600 2240 0.029 0.203 0.011 0.017 6.000 3.840 0.066 $0.302 0.018 0.025 projectWACC=5.01% Risk free rate of return= 1.68% (Internet Market rate of return = 5.00% (Internet) Credit Risk Rate = 8 (Assumed) Beta = 0.80 (assumed) Tc = 28% (assumed) E=Market value of the firm's equity $974,832.72 D=Market value of the firm's debt $77,466,666.00 So, V=E+D $78,441,498.72 E/V 0.012427513 D/V 0.9876 Re 0.04336 Rd 0.069696 WACC 0.050097731 WACC= 5.01% Capital Budgeting Analysis - Using the WACC obtained from in Step (4) as the discount rate for this project, apply capital budgeting analysis techniques (NPV, IRR, MIRR, PI, Payback, Discounted Payback) to analyze the new project.- Perform a sensitivity analysis for the effects of key variables (e.g., sales growth rate, cost of capital, unit costs, sales price) on the estimated NPV or IRR in order to demonstrate the sensitivity of the model. The Scenario analysis of several variables simultaneously is encouraged (but not required). A PDF document Altex Industries, Inc. (NBB: ALTX) 09/30/2019 09/30/2018 09/30/2017 09/30/2016 09/30/2015 Ratios Liquidity Ratios Current Ratio Quick Ratio Net Current Assets % TA 20 2 183 2292 2.095 2.189 50.98% 2.101 2.198 50.27% 2.283 51.80% 2.394 53.63% 3.049 3.180 63.57% 0.024 0.027 0.025 Asset Management Ratios Total Asset Turnover Receiable Turnover Accounts Payable Turnover Accrued Expense Turnover Property Plant & Equip Turnover Cash & Equivalent Turnover 5.333 0.052 0.723 0.025 8.533 0.059 0.621 0.028 11.091 0.056 0.517 0.025 0.011 5.600 2.240 0.029 0.203 0.011 0.017 6.000 3.840 0.066 $0.302 0.018 Debt Management Debt Ratio Times-interest-Earned (TIE) Ratio Debt to Equity Ratio 0.465 -1.627 0.871 0.457 -3.433 0.841 0.438 -8.167 0.779 0.415 -22.706 0.710 0.310 -21,470.588 0.450 Profitability Ratios Return on Total Asset (ROA, net) Return on Common Equity (ROE) Return on Investment (ROI, Operating) EBITDA Margin % EBITDA EBIT Operation Income -1.352% -3.002% -2.509% -5.430% - 11.60% -8.26% -78.57% -142.19% -$44,000.00 $91,000.00 -$83,000.00 -S103,000.00 -$148,000.00 -$111,000.00 -5.066% -8.830% - 10.27% -211.48% $129,000.00 $147,000.00 $150,000.00 -13.677% -21.410% -22.40% - 1300.00% $364,000.00 -$386,000.00 $386,000.00 - 12.269% - 16.635% -18.26% -718.75% $345,000,000 -$365,000,000 $382,000.00 Market Value Ratio Price/Earnings (P/E) Ratio EPS Basic EPS Diluted 0.000 0.000 0.000 0.000 0.000 0.000 0.000 0.000 0.000 0.000 205 Per Share Cash Flow per Share Book Value per Share 0.00041 0.103 -0.00438 0 .105 -0.00885 0.110 -0.00918 0.120 -0.00694 0.148 Altex Industries, Inc. (NBB: ALTX) 09/30/2019 09/30/2018 09/30/2017 09/30/2016 09/30/2015 Ratios Liquidity Ratios Current Ratio Quick Ratio Net Current Assets % TA 2.095 2.189 50.98% 2.101 2.198 50.27% 2.183 2.283 51.80% 2.292 2.394 53.63% 3.049 3.180 63.57% 0.024 0.027 0.025 Asset Management Ratios Total Asset Turnover Receiable Turnover Accounts Payable Turnover Accrued Expense Turnover Property Plant & Equip Turnover Cash & Equivalent Turnover 5.333 0.052 0.723 0.025 8.533 0.059 0.621 0.028 11.091 0.056 0.517 0.011 5.600 2240 0.029 0.203 0.011 0.017 6.000 3.840 0.066 $0.302 0.018 0.025 projectWACC=5.01% Risk free rate of return= 1.68% (Internet Market rate of return = 5.00% (Internet) Credit Risk Rate = 8 (Assumed) Beta = 0.80 (assumed) Tc = 28% (assumed) E=Market value of the firm's equity $974,832.72 D=Market value of the firm's debt $77,466,666.00 So, V=E+D $78,441,498.72 E/V 0.012427513 D/V 0.9876 Re 0.04336 Rd 0.069696 WACC 0.050097731 WACC= 5.01% Capital Budgeting
