

Answered step by step
Verified Expert Solution
Question
1 Approved Answer
Analytical procedures are a process consisting of four phases: expectation formation, identification, investigation, and evaluation. The most important phase is the first - expectation
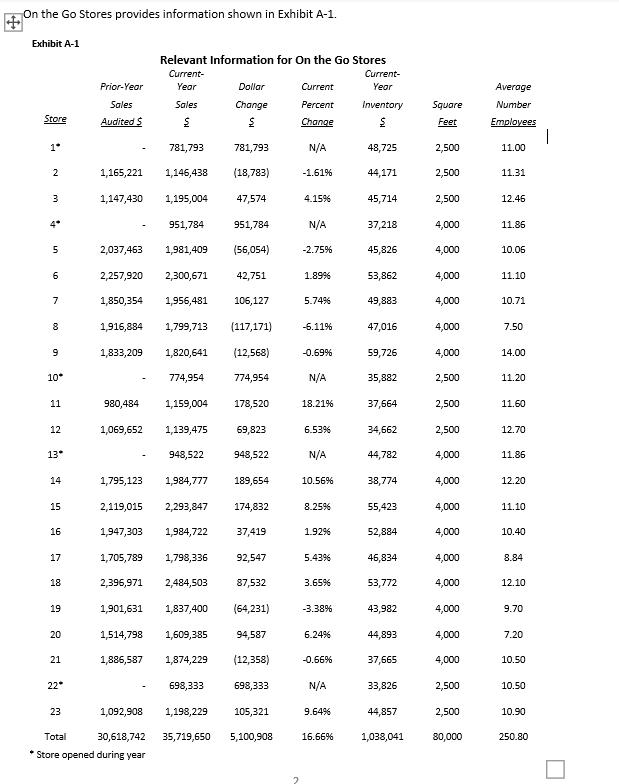

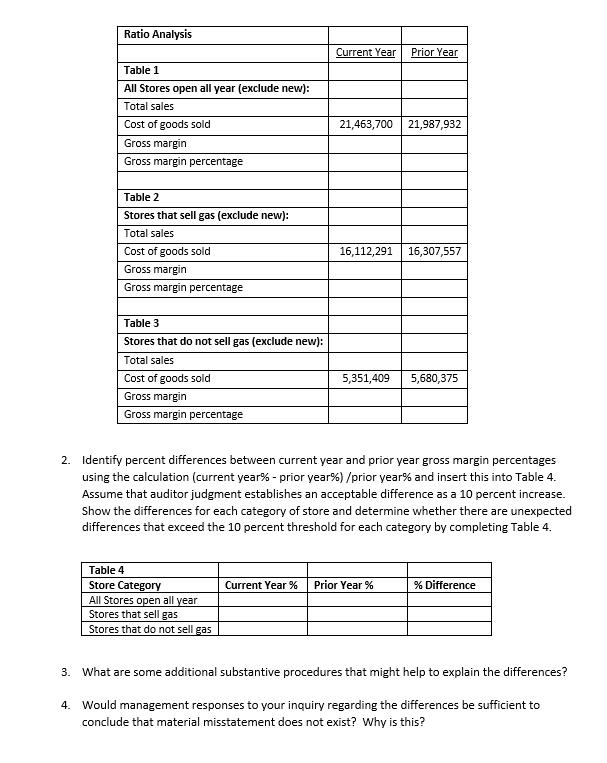
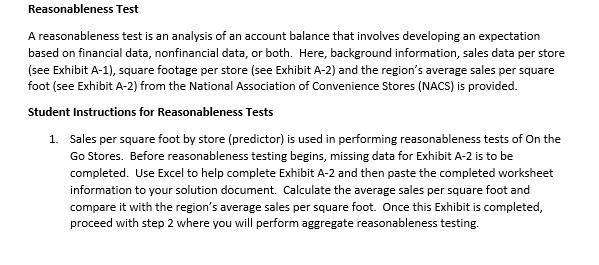
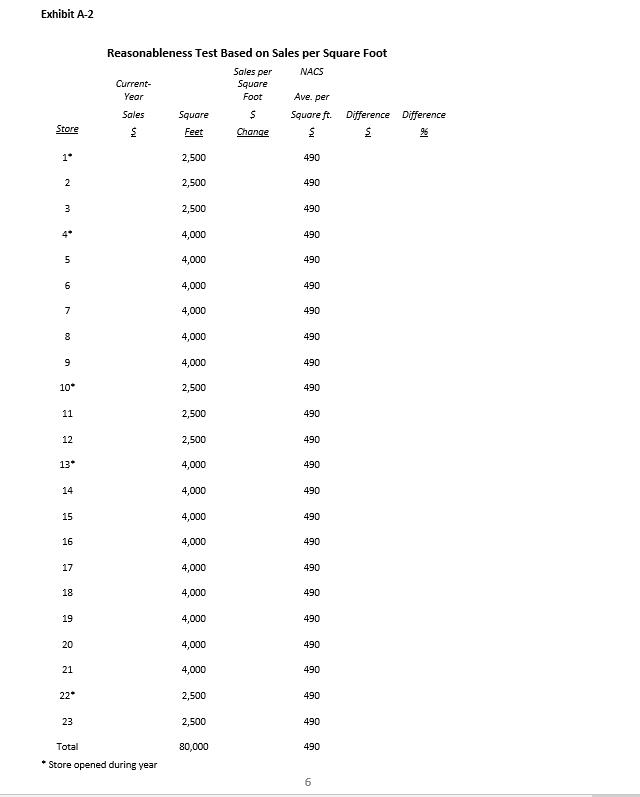
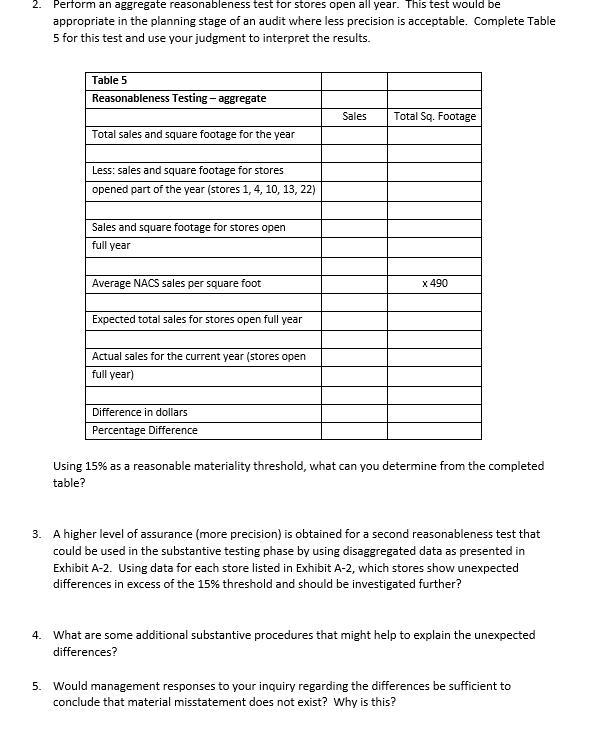
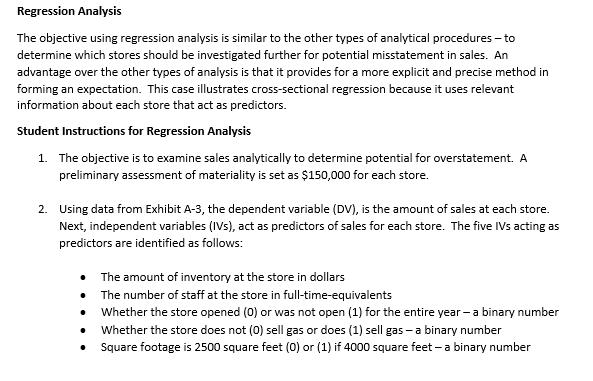
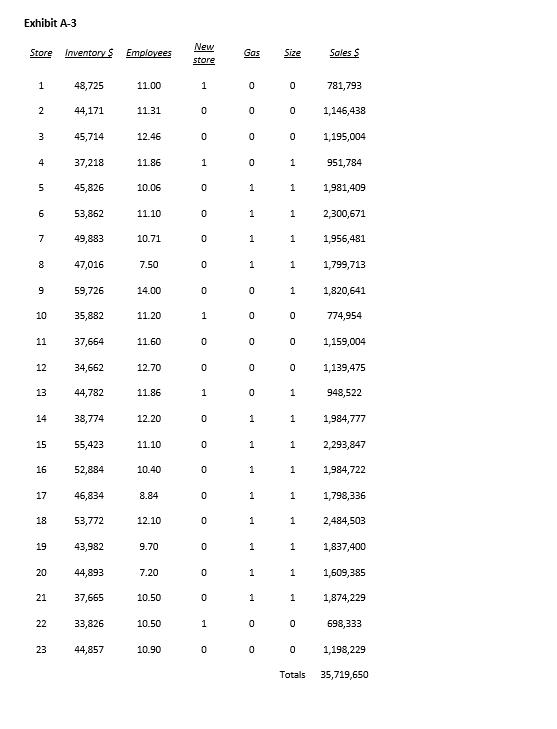
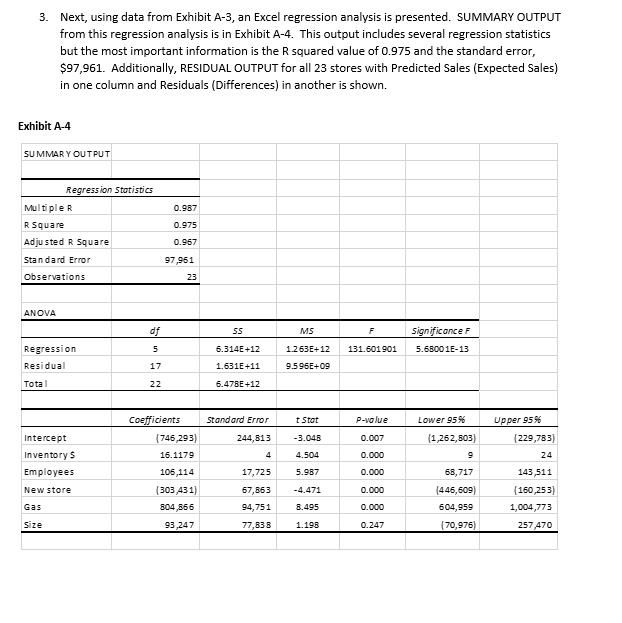
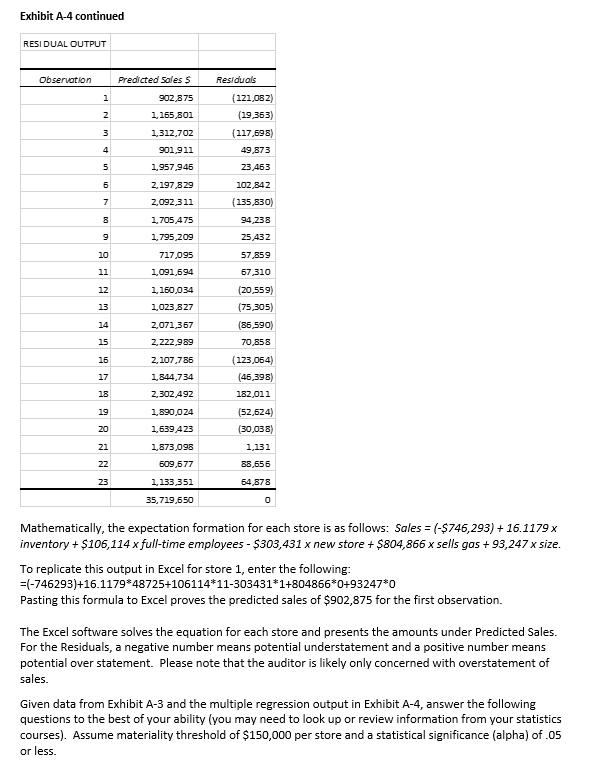
Analytical procedures are a process consisting of four phases: expectation formation, identification, investigation, and evaluation. The most important phase is the first - expectation formation - where the auditor develops expectations about an account balance or a plausible financial relationship. Auditors realize that numerical information of this nature is of little benefit without comparisons to benchmark expectations. Appropriate expectation methods range from simplistic to complex based on auditor judgment that considers the desired level of assurance for the procedure. Analytical procedures illustrated here include trend analysis, ratio analysis, reasonableness testing and regression analysis. This case demonstrates the use of analytical procedures in planning and substantive testing for a fictional chain of convenience stores named On the Go Stores. On the Go Stores has 23 convenience stores including five new stores (Stores 1, 4, 10, 13, and 22) that opened during the year. Operations vary by geographic location and the mix of products sold. The geographical placement of stores depends on several factors, such as competition and the economic environment of the location. Stores 2, 4, 6, 8, 9, 11, 13, 15, 17, 18, 20, 21, and 23 are considered to be in favorable locations. The mix of products and services at each store can vary depending on location and the most important factor is whether the store sells gasoline. Stores 5, 6, 7, 8, 14, 15, 16, 17, 18, 19, 20 and 21 sell gasoline. The mix of products offered for sale affects the volume of customers as well as the number of full-time employees. Trend Analysis Trend analysis considers changes in account balances over time and is most appropriate when the relationships are predictable. Therefore, the auditor must consider volatility of the business environment and corresponding effects on trends. Trend analysis might apply to both audit planning and for evidence gathering; therefore, high disaggregation of data is more likely in the substantive testing phase because of more precise expectation formation. On the Go Stores provides information shown in Exhibit A-1. Exhibit A-1 Store 1* 2 3 4* 5 6 7 8 9 10* 11 12 13* 14 15 16 17 18 19 20 21 22* 23 Relevant Information for On the Go Stores Current- Year Sales 781,793 781,793 1,146,438 (18,783) 1,195,004 47,574 951,784 951,784 2,037,463 1,981,409 (56,054) 2,257,920 2,300,671 42,751 1,850,354 1,956,481 106,127 1,916,884 1,799,713 1,833,209 1,820,641 Prior-Year Sales Audited $ 1,165,221 1,147,430 980,484 1,069,652 774,954 1,159,004 1,139,475 948,522 1,795,123 1,984,777 2,119,015 2,293,847 1,947,303 1,984,722 1,705,789 2,396,971 Total 30,618,742 Store opened during year Dollar Change $ (117,171) (12,568) 774,954 178,520 69,823 948,522 189,654 174,832 37,419 1,798,336 92,547 2,484,503 87,532 1,901,631 1,837,400 (64,231) 1,514,798 1,609,385 94,587 1,886,587 1,874,229 (12,358) 698,333 698,333 1,092,908 1,198,229 105,321 35,719,650 5,100,908 2 Current Percent Change N/A -1.61% 4.15% N/A -2.75% 1.89% 5.74% -6.11% -0.69% N/A 18.21% 6.53% N/A 10.56% 8.25% 1.92% 5.43% 3.65% -3.38% 6.24% -0.66% N/A 9.64% 16.66% Current- Year Inventory S 48,725 44,171 45,714 37,218 45,826 53,862 49,883 47,016 59,726 35,882 37,664 34,662 44,782 38,774 55,423 52,884 46,834 53,772 43,982 44,893 37,665 33,826 44,857 1,038,041 Square Feet 2,500 2,500 2,500 4,000 4,000 4,000 4,000 4,000 4,000 2,500 2,500 2,500 4,000 4,000 4,000 4,000 4,000 4,000 4,000 4,000 4,000 2,500 2,500 80,000 Average Number Employees 11.00 11.31 12.46 11.86 10.06 11.10 10.71 7.50 14.00 11.20 11.60 12.70 11.86 12.20 11.10 10.40 8.84 12.10 9.70 7.20 10.50 10.50 10.90 250.80 | Student Instructions for Trend Analysis 1. The planning expectation with simple trend analysis is that there will be no change from prior- year sales (predictor) in the current year. Auditors will consider materiality to be an 8 percent change from the prior year. First, examine only the aggregated data (totals) of sales in the planning stage of the audit. As there is not a high level of assurance for this stage, compare current year sales with prior year sales in a simple Excel table as follows: Current Year Prior Year Change % Change Next, eliminate the sales for the new stores opened for the year and compare the adjusted aggregated amount of current year sales compared to the prior year sales. Current Year Prior Year Change % Change Does this seem to make more sense - explain? The auditor must decide whether this percent change is acceptable for the stores open all year-what do you think? 2. Perform trend analysis as a substantive test on only stores that have been open all year. The expectation is that each store sales is predicted by its prior year sales. Use an 8 percent change materiality threshold for each store. From this test, list which stores should be investigated further. 3. What are some additional substantive procedures that might help to explain the differences? 4. Would management responses to your inquiry regarding the differences be sufficient to conclude that material misstatement does not exist? Why is this? Ratio Analysis Ratio analysis compares relationships between financial statement accounts, nonfinancial data, or a comparison of relationships across an industry. Here, background information, costs of goods sold, and sales in Exhibit A-1 provide data used in calculating gross margin (gross profit) percentages. Student Instructions for Ratio Analysis 1. Complete the following three tables by inserting appropriate numerical information and calculating gross margin percentages. Each table represents a store category-all stores, those that sell gas, and those that do not sell gas. Exclude new stores in each category. Expectation is that the gross profit percentage (predictor) for stores that sell gas will be higher than stores that do not sell gas. Ratio Analysis Table 1 All Stores open all year (exclude new): Total sales Cost of goods sold Gross margin Gross margin percentage Table 2 Stores that sell gas (exclude new): Total sales Cost of goods sold Gross margin Gross margin percentage Table 3 Stores that do not sell gas (exclude new): Total sales Cost of goods sold Gross margin Gross margin percentage Table 4 Store Category All Stores open all year Stores that sell gas Stores that do not sell gas Current Year Prior Year Current Year % 21,463,700 21,987,932 16,112,291 16,307,557 5,351,409 2. Identify percent differences between current year and prior year gross margin percentages using the calculation (current year% - prior year%) /prior year% and insert this into Table 4. Assume that auditor judgment establishes an acceptable difference as a 10 percent increase. Show the differences for each category of store and determine whether there are unexpected differences that exceed the 10 percent threshold for each category by completing Table 4. 5,680,375 Prior Year % % Difference 3. What are some additional substantive procedures that might help to explain the differences? 4. Would management responses to your inquiry regarding the differences be sufficient to conclude that material misstatement does not exist? Why is this? Reasonableness Test A reasonableness test is an analysis of an account balance that involves developing an expectation based on financial data, nonfinancial data, or both. Here, background information, sales data per store (see Exhibit A-1), square footage per store (see Exhibit A-2) and the region's average sales per square foot (see Exhibit A-2) from the National Association of Convenience Stores (NACS) is provided. Student Instructions for Reasonableness Tests 1. Sales per square foot by store (predictor) is used in performing reasonableness tests of On the Go Stores. Before reasonableness testing begins, missing data for Exhibit A-2 is to be completed. Use Excel to help complete Exhibit A-2 and then paste the completed worksheet information to your solution document. Calculate the average sales per square foot and compare it with the region's average sales per square foot. Once this Exhibit is completed, proceed with step 2 where you will perform aggregate reasonableness testing. Exhibit A-2 Store 1 2 3 5 6 7 8 9 10* 11 12 13* 14 15 16 17 18 19 20 21 22* 23 Reasonableness Test Based on Sales per Square Foot Sales per NACS Square Foot $ Change Current- Year Sales $ Total *Store opened during year Square Feet 2,500 2,500 2,500 4,000 4,000 4,000 4,000 4,000 4,000 2,500 2,500 2,500 4,000 4,000 4,000 4,000 4,000 4,000 4,000 4,000 4,000 2,500 2,500 80,000 Ave. per Square ft. $ 490 490 490 490 490 490 490 490 490 490 490 490 490 490 490 490 490 490 490 490 490 490 490 490 6 Difference $ Difference 96 2. Perform an aggregate reasonableness test for stores open all year. This test would be appropriate in the planning stage of an audit where less precision is acceptable. Complete Table 5 for this test and use your judgment to interpret the results. Table 5 Reasonableness Testing - aggregate Total sales and square footage for the year Less: sales and square footage for stores opened part of the year (stores 1, 4, 10, 13, 22) Sales and square footage for stores open full year Average NACS sales per square foot Expected total sales for stores open full year Actual sales for the current year (stores open full year) Difference in dollars Percentage Difference Sales Total Sq. Footage x 490 Using 15% as a reasonable materiality threshold, what can you determine from the completed table? 3. A higher level of assurance (more precision) is obtained for a second reasonableness test that could be used in the substantive testing phase by using disaggregated data as presented in Exhibit A-2. Using data for each store listed in Exhibit A-2, which stores show unexpected differences in excess of the 15% threshold and should be investigated further? 4. What are some additional substantive procedures that might help to explain the unexpected differences? 5. Would management responses to your inquiry regarding the differences be sufficient to conclude that material misstatement does not exist? Why is this? Regression Analysis The objective using regression analysis is similar to the other types of analytical procedures - to determine which stores should be investigated further for potential misstatement in sales. An advantage over the other types of analysis is that it provides for a more explicit and precise method in forming an expectation. This case illustrates cross-sectional regression because it uses relevant information about each store that act as predictors. Student Instructions for Regression Analysis 1. The objective is to examine sales analytically to determine potential for overstatement. A preliminary assessment of materiality is set as $150,000 for each store. 2. Using data from Exhibit A-3, the dependent variable (DV), is the amount of sales at each store. Next, independent variables (IVs), act as predictors of sales for each store. The five IVs acting as predictors are identified as follows: The amount of inventory at the store in dollars The number of staff at the store in full-time-equivalents Whether the store opened (0) or was not open (1) for the entire year- a binary number Whether the store does not (0) sell gas or does (1) sell gas- a binary number . Square footage is 2500 square feet (0) or (1) if 4000 square feet - a binary number Exhibit A-3 Store Inventory $ Employees 1 2 3 4 5 6 7 8 9 10 11 12 13 14 15 16 17 18 19 20 21 22 23 48,725 44,171 45,714 37,218 45,826 53,862 49,883 47,016 59,726 35,882 37,664 34,662 44,782 38,774 55,423 52,884 46,834 53,772 43,982 44,893 37,665 33,826 44,857 11.00 11.31 12.46 11.86 10.06 11.10 10.71 7.50 14.00 11.20 11.60 12.70 11.86 12.20 11.10 10.40 8.84 12.10 9.70 7.20 10.50 10.50 10.90 New store 1 0 0 1 0 0 0 0 0 1 0 0 1 0 0 0 0 0 0 0 0 1 0 Gas Size 0 0 0 0 1 1 1 1 0 0 0 0 0 1 1 1 1 1 1 1 0 0 0 0 1 1 1 1 1 1 0 0 0 1 1 1 1 1 1 1,798,336 2,484,503 1,837,400 1,609,385 1,874,229 698,333 1,198,229 Totals 35,719,650 1 1 1 0 Sales $ 0 0 781,793 1,146,438 1,195,004 951,784 1,981,409 2,300,671 1,956,481 1,799,713 1,820,641 774,954 1,159,004 1,139,475 948,522 1,984,777 2,293,847 1,984,722 3. Next, using data from Exhibit A-3, an Excel regression analysis is presented. SUMMARY OUTPUT from this regression analysis is in Exhibit A-4. This output includes several regression statistics but the most important information is the R squared value of 0.975 and the standard error, $97,961. Additionally, RESIDUAL OUTPUT for all 23 stores with Predicted Sales (Expected Sales) in one column and Residuals (Differences) in another is shown. Exhibit A-4 SUMMARY OUTPUT Regression Statistics Multiple R R Square Adjusted R Square Standard Error Observations ANOVA Regression Residual Total Intercept Inventory S Employees New store Gas Size of 5 17 22 0.987 0.975 0.967 97,961 Coefficients 23 (746,293) 16.1179 106,114 (303, 431) 804,866 93,247 55 6.314E+12 1.631E+11 6.478E+12 Standard Error 244,813 4 17,725 67,863 94,751 77,83 8 MS 1.263E+12 131.601901 9.596E+09 t Stat -3.048 4.504 5.987 -4.471 8.495 F 1.198 P-value 0.007 0.000 0.000 0.000 0.000 0.247 Significance F 5.68001E-13 Lower 95% (1,262,803) 9 68,717 (446,609) 604,959 (70,976) Upper 95% (229,783) 24 143,511 (160,253) 1,004,773 257,470 Exhibit A-4 continued RESIDUAL OUTPUT Observation 1 2 3 4 5 6 7 8 9 10 11 12 13 14 15 16 17 18 N 19 20 21 22 23 Predicted Sales 5 902,875 1,165,801 1,312,702 901,911 1,957,946 2,197,829 2,092,311 1,705,475 1,795,209 717,095 1,091,694 1,160,034 1,023,827 2,071,367 2,222,989 2,107,786 1,844,734 2,302,492 1,890,024 1,639,423 1,873,098 609,677 1,133,351 35,719,650 Residuals (121,082) (19,363) (117,698) 49,873 23,463 102,842 (135,830) 94,238 25,432 57,859 67,310 (20,559) (75,305) (86,590) 70,858 (123,064) (46,398) 182,011 (52,624) (30,038) 1,131 88,656 64,878 0 Mathematically, the expectation formation for each store is as follows: Sales = (-$746,293) + 16.1179 x inventory + $106,114 x full-time employees - $303,431 x new store + $804,866 x sells gas + 93,247 x size. To replicate this output in Excel for store 1, enter the following: =(-746293)+16.1179*48725+106114*11-303431*1+804866*0+93247*0 Pasting this formula to Excel proves the predicted sales of $902,875 for the first observation. The Excel software solves the equation for each store and presents the amounts under Predicted Sales. For the Residuals, a negative number means potential understatement and a positive number means potential over statement. Please note that the auditor is likely only concerned with overstatement of sales. Given data from Exhibit A-3 and the multiple regression output in Exhibit A-4, answer the following questions to the best of your ability (you may need to look up or review information from your statistics courses). Assume materiality threshold of $150,000 per store and a statistical significance (alpha) of .05 or less. 4. What does the R Square value of .975 as presented in the Regression Statistics mean? 5. The Standard Error is $97,961. What does this indicate? 6. For Analysis of Variance (ANOVA), what does the Significance of the F statistic (F-test for the null hypothesis) indicate? 7. For the Coefficients output, what do the t statistic P values indicate? Are any of these insignificant? 8. In this step, you will replicate the regression analysis from step 3 except you will remove the Size variable to potentially improve the SE and t statistics of the four remaining independent variables. Your output should resemble Exhibit A-4, but it will not be exactly the same because you are using only four independent variables. First, copy and paste the information from Exhibit A-3 to an Excel worksheet with the upper left hand cell as A7 where the term Store will appear. In Excel, select the Data Tab and then Data Analysis. Choose Regression from the Data Analysis box and select OK. In this case, select G7:G30 as the range for the dependent variable input and 87:E30 as ranges for the independent variable input. Note that this range will exclude Size as an independent variable. Include in these ranges a row at the top of the workbook, which gives the name of the variable in each column so the regression output will label the variables properly. Select Labels in Excel and then select the output among the report options (in this case, cell A40). To calculate the residual amounts for each item, select the Residual's box. The regression for On the Go Stores should show output starting in cell A40 on your Excel worksheet and while similar to what appeared in Exhibit A-4 be aware the amounts will differ because you are excluding Size as a variable. Label your output Exhibit A-5, Removing Size as a Variable below. It works best to run the Excel regression, convert the output to 9 point font, format the numbers so they appear similar to Exhibit A-4, then copy and paste as a picture to this Word document after following the regression instructions. 9. Examining the regression SUMMARY OUTPUT in Exhibit A-5, what can you say about the statistical measures and is this preferred to statistical measures in Exhibit A-4? 10. As an auditor, what would you expect to do at this point given your understanding of the regression output and specifically, the RESIDUAL OUTPUT in Exhibit A-5?
Step by Step Solution
★★★★★
3.42 Rating (158 Votes )
There are 3 Steps involved in it
Step: 1
Analytical Procedures in Auditing A Case Study of On the Go Stores This document explores the application of analytical procedures in auditing utilizing the fictional case study of On the Go Stores a ...
Get Instant Access to Expert-Tailored Solutions
See step-by-step solutions with expert insights and AI powered tools for academic success
Step: 2

Step: 3
Ace Your Homework with AI
Get the answers you need in no time with our AI-driven, step-by-step assistance
Get Started
Auditing and Assurance services an integrated approach
Authors: Alvin a. arens, Randal j. elder, Mark s. Beasley
14th Edition
133081605, 132575957, 9780133081602, 978-0132575959