Answered step by step
Verified Expert Solution
Question
1 Approved Answer
Analytics Exercise 4-01 to 4-07 (Algo) One interesting manufacturing story in recent history relates to Tesla's Model 3. The car was introduced on March 31,
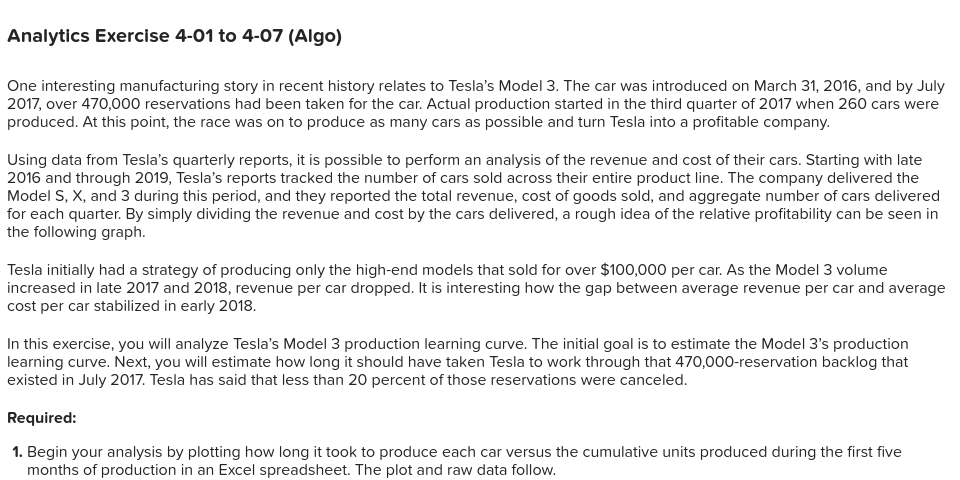
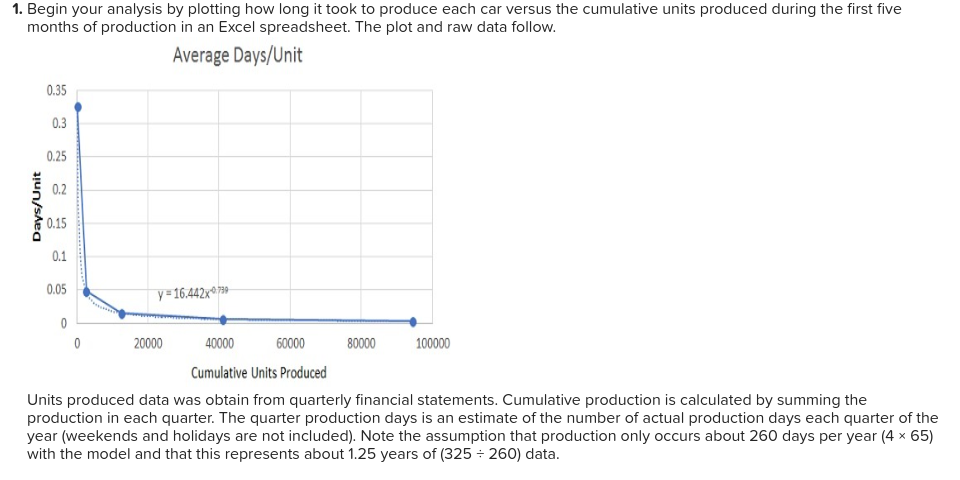
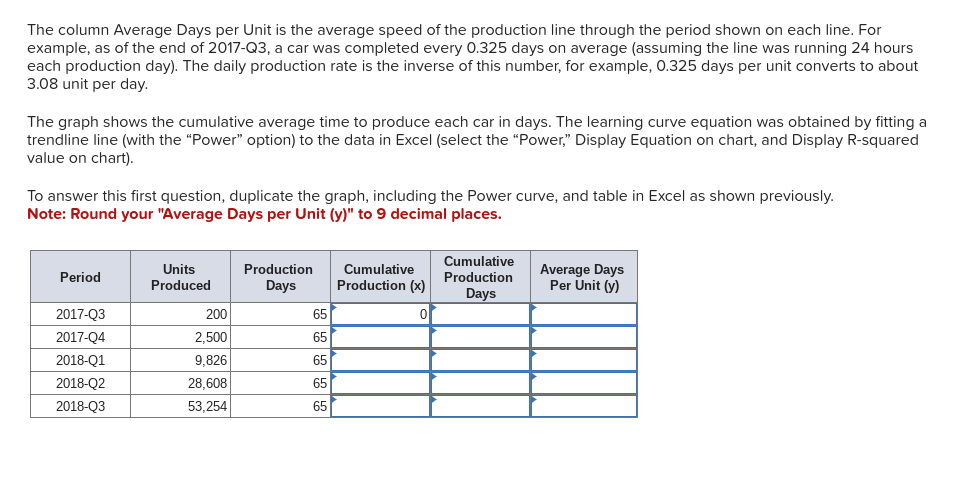
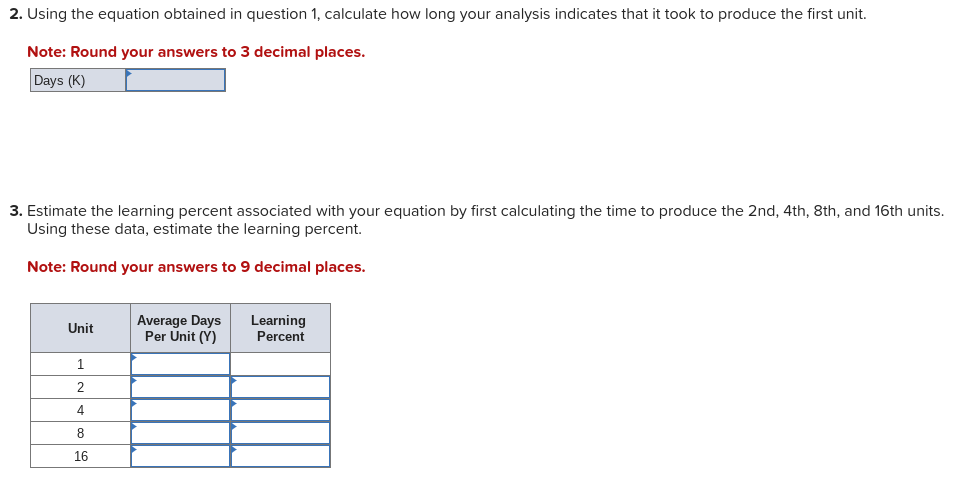
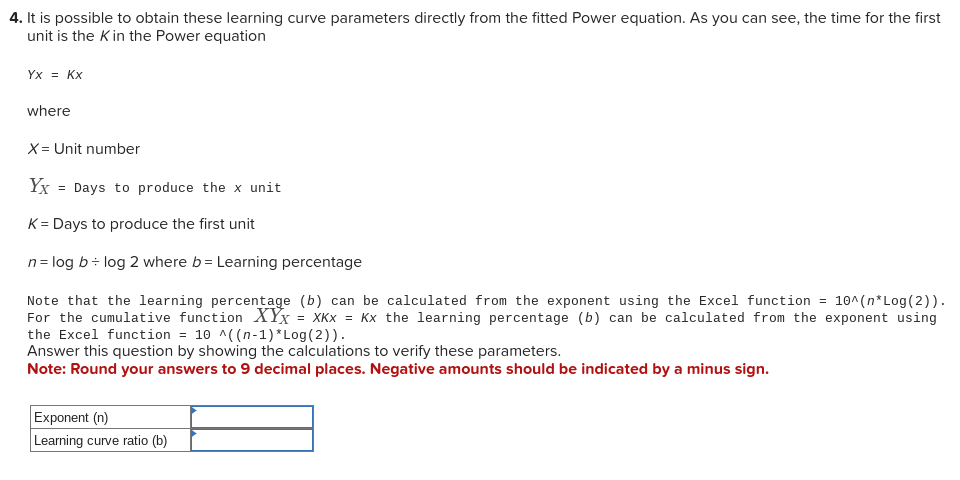
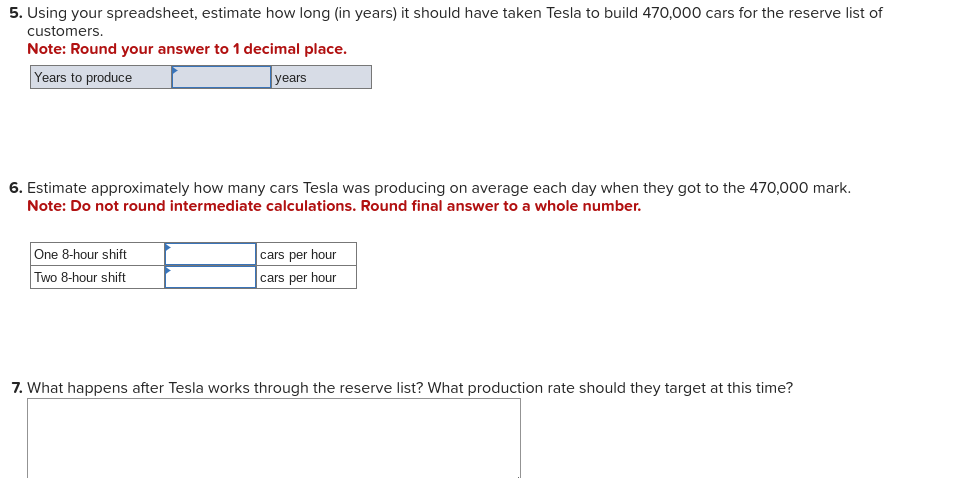 Analytics Exercise 4-01 to 4-07 (Algo) One interesting manufacturing story in recent history relates to Tesla's Model 3. The car was introduced on March 31, 2016, and by July 2017, over 470,000 reservations had been taken for the car. Actual production started in the third quarter of 2017 when 260 cars were produced. At this point, the race was on to produce as many cars as possible and turn Tesla into a profitable company. Using data from Tesla's quarterly reports, it is possible to perform an analysis of the revenue and cost of their cars. Starting with late 2016 and through 2019, Tesla's reports tracked the number of cars sold across their entire product line. The company delivered the Model S, X, and 3 during this period, and they reported the total revenue, cost of goods sold, and aggregate number of cars delivered for each quarter. By simply dividing the revenue and cost by the cars delivered, a rough idea of the relative profitability can be seen in the following graph. Tesla initially had a strategy of producing only the high-end models that sold for over $100,000 per car. As the Model 3 volume increased in late 2017 and 2018, revenue per car dropped. It is interesting how the gap between average revenue per car and average cost per car stabilized in early 2018. In this exercise, you will analyze Tesla's Model 3 production learning curve. The initial goal is to estimate the Model 3's production learning curve. Next, you will estimate how long it should have taken Tesla to work through that 470,000-reservation backlog that existed in July 2017. Tesla has said that less than 20 percent of those reservations were canceled. Required: 1. Begin your analysis by plotting how long it took to produce each car versus the cumulative units produced during the first five months of production in an Excel spreadsheet. The plot and raw data follow. 1. Begin your analysis by plotting how long it took to produce each car versus the cumulative units produced during the first five months of production in an Excel spreadsheet. The plot and raw data follow. Units produced data was obtain from quarterly financial statements. Cumulative production is calculated by summing the production in each quarter. The quarter production days is an estimate of the number of actual production days each quarter of the year (weekends and holidays are not included). Note the assumption that production only occurs about 260 days per year (465) with the model and that this represents about 1.25 years of (325260) data. 2. Using the equation obtained in question 1 , calculate how long your analysis indicates that it took to produce the first unit. Note: Round your answers to 3 decimal places. 3. Estimate the learning percent associated with your equation by first calculating the time to produce the 2 nd, 4 th, 8 th, and 16 th units. Using these data, estimate the learning percent. Note: Round your answers to 9 decimal places. 4. It is possible to obtain these learning curve parameters directly from the fitted Power equation. As you can see, the time for the first unit is the K in the Power equation YX=Kx where X= Unit number YX= Days to produce the x unit K= Days to produce the first unit n=logblog2 where b= Learning percentage Note that the learning percentage (b) can be calculated from the exponent using the Excel function =10(nlog(2)). For the cumulative function XYX=XKX=Kx the learning percentage (b) can be calculated from the exponent using the Excel function =10((n1)log(2)). Answer this question by showing the calculations to verify these parameters. Note: Round your answers to 9 decimal places. Negative amounts should be indicated by a minus sign. The column Average Days per Unit is the average speed of the production line through the period shown on each line. For example, as of the end of 2017-Q3, a car was completed every 0.325 days on average (assuming the line was running 24 hours each production day). The daily production rate is the inverse of this number, for example, 0.325 days per unit converts to about 3.08 unit per day. The graph shows the cumulative average time to produce each car in days. The learning curve equation was obtained by fitting a trendline line (with the "Power" option) to the data in Excel (select the "Power," Display Equation on chart, and Display R-squared value on chart). To answer this first question, duplicate the graph, including the Power curve, and table in Excel as shown previously. Note: Round your "Average Days per Unit (y)" to 9 decimal places. 5. Using your spreadsheet, estimate how long (in years) it should have taken Tesla to build 470,000 cars for the reserve list of customers. Note: Round your answer to 1 decimal place. 6. Estimate approximately how many cars Tesla was producing on average each day when they got to the 470,000 mark. Note: Do not round intermediate calculations. Round final answer to a whole number. 7. What happens after Tesla works through the reserve list? What production rate should they target at this time? Analytics Exercise 4-01 to 4-07 (Algo) One interesting manufacturing story in recent history relates to Tesla's Model 3. The car was introduced on March 31, 2016, and by July 2017, over 470,000 reservations had been taken for the car. Actual production started in the third quarter of 2017 when 260 cars were produced. At this point, the race was on to produce as many cars as possible and turn Tesla into a profitable company. Using data from Tesla's quarterly reports, it is possible to perform an analysis of the revenue and cost of their cars. Starting with late 2016 and through 2019, Tesla's reports tracked the number of cars sold across their entire product line. The company delivered the Model S, X, and 3 during this period, and they reported the total revenue, cost of goods sold, and aggregate number of cars delivered for each quarter. By simply dividing the revenue and cost by the cars delivered, a rough idea of the relative profitability can be seen in the following graph. Tesla initially had a strategy of producing only the high-end models that sold for over $100,000 per car. As the Model 3 volume increased in late 2017 and 2018, revenue per car dropped. It is interesting how the gap between average revenue per car and average cost per car stabilized in early 2018. In this exercise, you will analyze Tesla's Model 3 production learning curve. The initial goal is to estimate the Model 3's production learning curve. Next, you will estimate how long it should have taken Tesla to work through that 470,000-reservation backlog that existed in July 2017. Tesla has said that less than 20 percent of those reservations were canceled. Required: 1. Begin your analysis by plotting how long it took to produce each car versus the cumulative units produced during the first five months of production in an Excel spreadsheet. The plot and raw data follow. 1. Begin your analysis by plotting how long it took to produce each car versus the cumulative units produced during the first five months of production in an Excel spreadsheet. The plot and raw data follow. Units produced data was obtain from quarterly financial statements. Cumulative production is calculated by summing the production in each quarter. The quarter production days is an estimate of the number of actual production days each quarter of the year (weekends and holidays are not included). Note the assumption that production only occurs about 260 days per year (465) with the model and that this represents about 1.25 years of (325260) data. 2. Using the equation obtained in question 1 , calculate how long your analysis indicates that it took to produce the first unit. Note: Round your answers to 3 decimal places. 3. Estimate the learning percent associated with your equation by first calculating the time to produce the 2 nd, 4 th, 8 th, and 16 th units. Using these data, estimate the learning percent. Note: Round your answers to 9 decimal places. 4. It is possible to obtain these learning curve parameters directly from the fitted Power equation. As you can see, the time for the first unit is the K in the Power equation YX=Kx where X= Unit number YX= Days to produce the x unit K= Days to produce the first unit n=logblog2 where b= Learning percentage Note that the learning percentage (b) can be calculated from the exponent using the Excel function =10(nlog(2)). For the cumulative function XYX=XKX=Kx the learning percentage (b) can be calculated from the exponent using the Excel function =10((n1)log(2)). Answer this question by showing the calculations to verify these parameters. Note: Round your answers to 9 decimal places. Negative amounts should be indicated by a minus sign. The column Average Days per Unit is the average speed of the production line through the period shown on each line. For example, as of the end of 2017-Q3, a car was completed every 0.325 days on average (assuming the line was running 24 hours each production day). The daily production rate is the inverse of this number, for example, 0.325 days per unit converts to about 3.08 unit per day. The graph shows the cumulative average time to produce each car in days. The learning curve equation was obtained by fitting a trendline line (with the "Power" option) to the data in Excel (select the "Power," Display Equation on chart, and Display R-squared value on chart). To answer this first question, duplicate the graph, including the Power curve, and table in Excel as shown previously. Note: Round your "Average Days per Unit (y)" to 9 decimal places. 5. Using your spreadsheet, estimate how long (in years) it should have taken Tesla to build 470,000 cars for the reserve list of customers. Note: Round your answer to 1 decimal place. 6. Estimate approximately how many cars Tesla was producing on average each day when they got to the 470,000 mark. Note: Do not round intermediate calculations. Round final answer to a whole number. 7. What happens after Tesla works through the reserve list? What production rate should they target at this time
 Step by Step Solution
There are 3 Steps involved in it
Step: 1

Get Instant Access to Expert-Tailored Solutions
See step-by-step solutions with expert insights and AI powered tools for academic success
Step: 2

Step: 3

Ace Your Homework with AI
Get the answers you need in no time with our AI-driven, step-by-step assistance
Get Started


