Analyze and report the year over year change in cash using the Statement of Cash Flows and your Balance Sheet Variance Analysis by writing a paragraph. Also prepare a report (1 - 2 paragraphs maximum) explaining the change in Revenue.
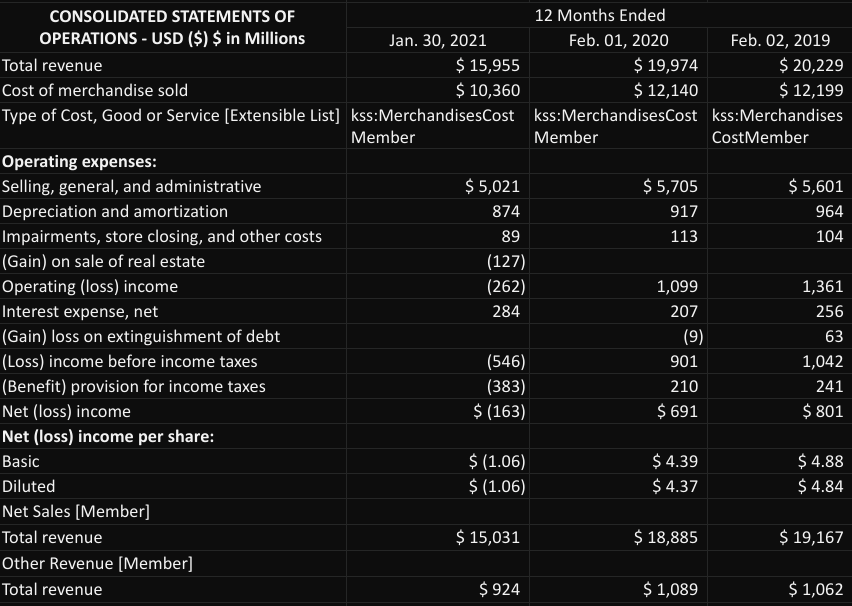
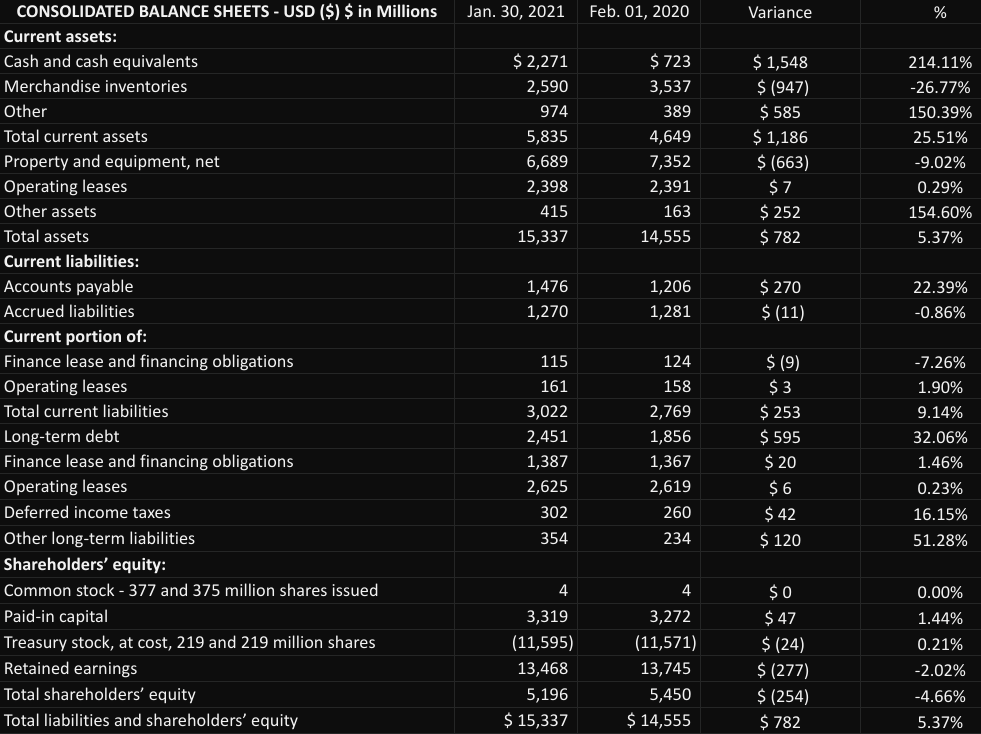
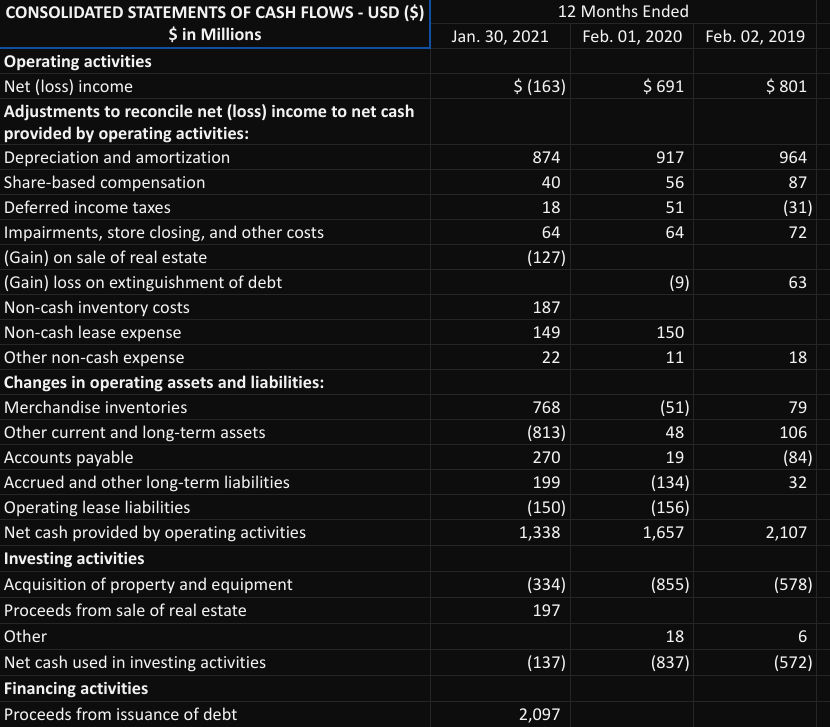
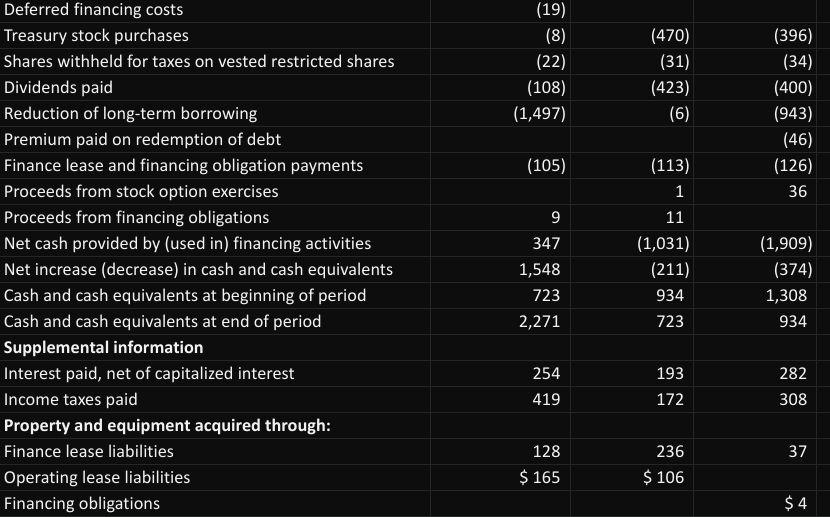
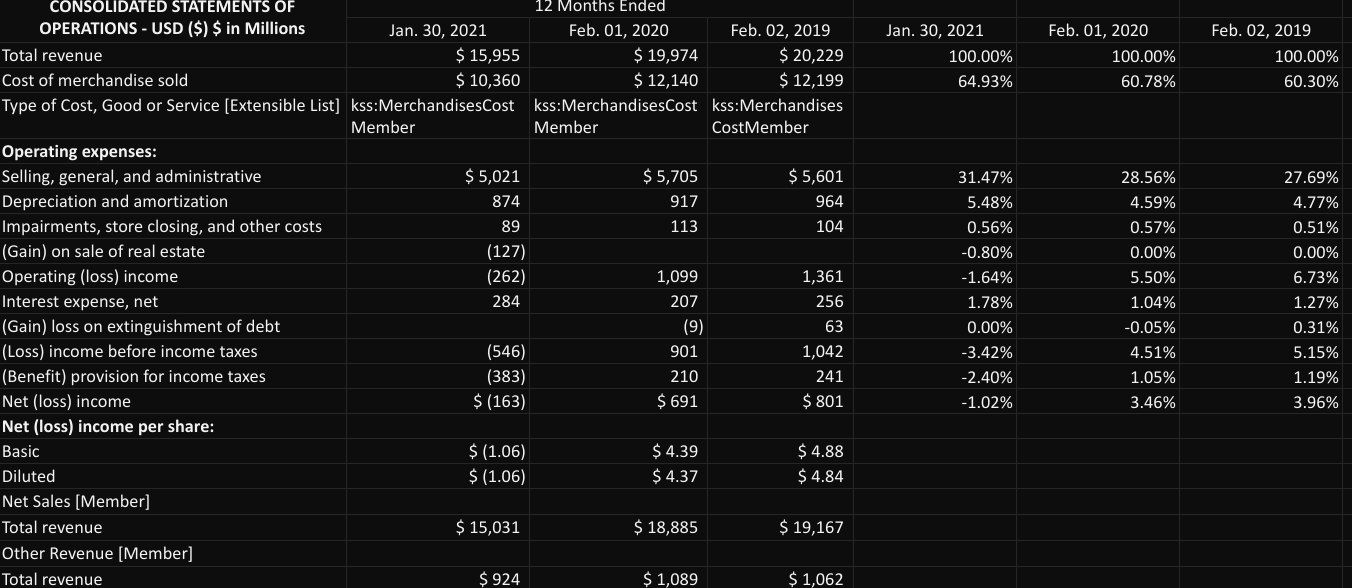
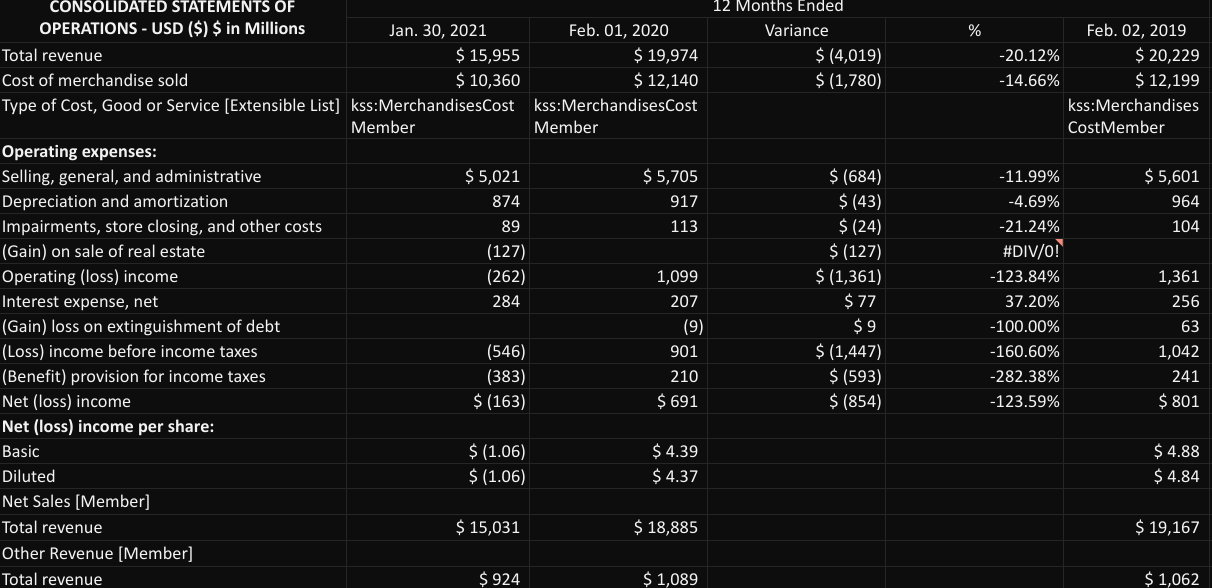
CONSOLIDATED STATEMENTS OF 12 Months Ended OPERATIONS - USD ($) $ in Millions Jan. 30, 2021 Feb. 01, 2020 Feb. 02, 2019 Total revenue $ 15,955 $ 19,974 $ 20,229 Cost of merchandise sold $ 10,360 $ 12,140 $ 12,199 Type of Cost, Good or Service [Extensible List] kss:MerchandisesCostkss:MerchandisesCost_kss:Merchandises Member Member CostMember Operating expenses: Selling, general, and administrative $ 5,021 $ 5,705 $ 5,601 Depreciation and amortization 874 917 964 Impairments, store closing, and other costs 89 113 104 (Gain) on sale of real estate (127) Operating (loss) income (262) 1,099 1,361 Interest expense, net 284 207 256 (Gain) loss on extinguishment of debt (9) 63 (Loss) income before income taxes (546) 901 1,042 (Benefit) provision for income taxes (383) 210 241 Net (loss) income $ (163) $ 691 $ 801 Net (loss) income per share: $ (1.06) $ 4.39 $ 4.88 Diluted $ (1.06) $ 4.37 $ 4.84 Net Sales [Member] Total revenue $ 15,031 $ 18,885 $ 19,167 Other Revenue (Member) Total revenue $ 924 $ 1,089 $ 1,062 Basic Jan. 30, 2021 Feb. 01, 2020 Variance % $ 2,271 2,590 974 5,835 6,689 2,398 415 15,337 $723 3,537 389 4,649 7,352 2,391 163 14,555 $ 1,548 $ (947) $ 585 $ 1,186 $ (663) $7 $ 252 $ 782 214.11% -26.77% 150.39% 25.51% -9.02% 0.29% 154.60% 5.37% 1,476 1,270 1,206 1,281 $ 270 $ (11) 22.39% -0.86% CONSOLIDATED BALANCE SHEETS - USD ($) $ in Millions Current assets: Cash and cash equivalents Merchandise inventories Other Total current assets Property and equipment, net Operating leases Other assets Total assets Current liabilities: Accounts payable Accrued liabilities Current portion of: Finance lease and financing obligations Operating leases Total current liabilities Long-term debt Finance lease and financing obligations Operating leases Deferred income taxes Other long-term liabilities Shareholders' equity: Common stock - 377 and 375 million shares issued Paid-in capital Treasury stock, at cost, 219 and 219 million shares Retained earnings Total shareholders' equity Total liabilities and shareholders' equity 115 -7.26% 161 3,022 2,451 1,387 2,625 302 124 158 2,769 1,856 1,367 2,619 260 $ (9) $3 $ 253 $ 595 $ 20 $ 6 $ 42 $ 120 1.90% 9.14% 32.06% 1.46% 0.23% 16.15% 51.28% 354 234 4 4 3,319 (11,595) 13,468 5,196 $ 15,337 3,272 (11,571) 13,745 5,450 $ 14,555 $0 $ 47 $ (24) $ (277) $ (254) $ 782 0.00% 1.44% 0.21% -2.02% -4.66% 5.37% 12 Months Ended Feb. 01, 2020 Jan. 30, 2021 Feb. 02, 2019 $ (163) $ 691 $ 801 874 40 18 917 56 51 964 87 (31) 72 64 64 (127) (9) 63 187 149 22 150 11 CONSOLIDATED STATEMENTS OF CASH FLOWS - USD ($) $ in Millions Operating activities Net (loss) income Adjustments to reconcile net (loss) income to net cash provided by operating activities: Depreciation and amortization Share-based compensation Deferred income taxes Impairments, store closing, and other costs (Gain) on sale of real estate (Gain) loss on extinguishment of debt Non-cash inventory costs Non-cash lease expense Other non-cash expense Changes in operating assets and liabilities: Merchandise inventories Other current and long-term assets Accounts payable Accrued and other long-term liabilities Operating lease liabilities Net cash provided by operating activities Investing activities Acquisition of property and equipment Proceeds from sale of real estate Other Net cash used in investing activities Financing activities Proceeds from issuance of debt 18 768 (813) 270 199 (150) 1,338 (51) 48 19 (134) (156) 1,657 79 106 (84) 32 2,107 (855) (578) (334) 197 18 (837) 6 (572) (137) 2,097 (19) (8) (22) (108) (1,497) (470) (31) (423) (6) (396) (34) (400) (943) (46) (126) 36 (105) 9 347 Deferred financing costs Treasury stock purchases Shares withheld for taxes on vested restricted shares Dividends paid Reduction of long-term borrowing Premium paid on redemption of debt Finance lease and financing obligation payments Proceeds from stock option exercises Proceeds from financing obligations Net cash provided by (used in) financing activities Net increase (decrease) in cash and cash equivalents Cash and cash equivalents at beginning of period Cash and cash equivalents at end of period Supplemental information Interest paid, net of capitalized interest Income taxes paid Property and equipment acquired through: Finance lease liabilities Operating lease liabilities Financing obligations (113) 1 11 (1,031) (211) 934 723 1,548 723 2,271 (1,909) (374) 1,308 934 254 193 282 308 419 172 128 37 236 $ 106 $ 165 $ $4 Jan. 30, 2021 100.00% 64.93% Feb. 01, 2020 100.00% 60.78% Feb. 02, 2019 100.00% 60.30% CONSOLIDATED STATEMENTS OF 12 Months Ended OPERATIONS - USD ($) $ in Millions Jan. 30, 2021 Feb. 01, 2020 Feb. 02, 2019 Total revenue $ 15,955 $ 19,974 $ 20,229 Cost of merchandise sold $ 10,360 $ 12,140 $ 12,199 Type of Cost, Good or Service (Extensible List] kss:MerchandisesCost kss:MerchandisesCost kss:Merchandises Member Member CostMember Operating expenses: Selling, general, and administrative $ 5,021 $ 5,705 $ 5,601 Depreciation and amortization 874 917 964 Impairments, store closing, and other costs 89 113 104 (Gain) on sale of real estate (127) Operating (loss) income (262) 1,099 1,361 Interest expense, net 284 207 256 (Gain) loss on extinguishment of debt (9) 63 (Loss) income before income taxes (546) 901 1,042 (Benefit) provision for income taxes (383) 210 241 Net (loss) income $ (163) $ 691 $ 801 Net (loss) income per share: Basic $ (1.06) $4.39 $ 4.88 Diluted $ (1.06) $ 4.37 $ 4.84 Net Sales (Member) Total revenue $ 15,031 $ 18,885 $ 19,167 Other Revenue (Member) Total revenue $ 924 $1,089 $ 1,062 31.47% 5.48% 0.56% -0.80% -1.64% 1.78% 0.00% -3.42% -2.40% -1.02% 28.56% 4.59% 0.57% 0.00% 5.50% 1.04% -0.05% 4.51% 1.05% 3.46% 27.69% 4.77% 0.51% 0.00% 6.73% 1.27% 0.31% 5.15% 1.19% 3.96% % 12 Months Ended Variance $ (4,019) $ (1,780) Feb. 02, 2019 -20.12% $ 20,229 -14.66% $ 12,199 kss:Merchandises CostMember $ 5,601 964 104 CONSOLIDATED STATEMENTS OF OPERATIONS - USD ($) $ in Millions Jan. 30, 2021 Feb. 01, 2020 Total revenue $ 15,955 $ 19,974 Cost of merchandise sold $ 10,360 $ 12,140 Type of Cost, Good or Service (Extensible List] kss:MerchandisesCost kss:MerchandisesCost Member Member Operating expenses: Selling, general, and administrative $ 5,021 $ 5,705 Depreciation and amortization 874 917 Impairments, store closing, and other costs 89 113 (Gain) on sale of real estate (127) Operating (loss) income (262) 1,099 Interest expense, net 284 207 (Gain) loss on extinguishment of debt (9) (Loss) income before income taxes (546) 901 (Benefit) provision for income taxes (383) 210 Net (loss) income $ (163) $ 691 Net (loss) income per share: Basic $ (1.06) $4.39 Diluted $ (1.06) $ 4.37 Net Sales (Member) Total revenue $ 15,031 $ 18,885 Other Revenue (Member) Total revenue $ 924 $ 1,089 $ (684) $ (43) $ (24) $ (127) $ (1,361) $77 $ 9 $ (1,447) $ (593) $ (854) -11.99% -4.69% -21.24% #DIV/0! -123.84% 37.20% -100.00% -160.60% -282.38% -123.59% 1,361 256 63 1,042 241 $ 801 $ 4.88 $ 4.84 $ 19,167 $ 1,062 CONSOLIDATED STATEMENTS OF 12 Months Ended OPERATIONS - USD ($) $ in Millions Jan. 30, 2021 Feb. 01, 2020 Feb. 02, 2019 Total revenue $ 15,955 $ 19,974 $ 20,229 Cost of merchandise sold $ 10,360 $ 12,140 $ 12,199 Type of Cost, Good or Service [Extensible List] kss:MerchandisesCostkss:MerchandisesCost_kss:Merchandises Member Member CostMember Operating expenses: Selling, general, and administrative $ 5,021 $ 5,705 $ 5,601 Depreciation and amortization 874 917 964 Impairments, store closing, and other costs 89 113 104 (Gain) on sale of real estate (127) Operating (loss) income (262) 1,099 1,361 Interest expense, net 284 207 256 (Gain) loss on extinguishment of debt (9) 63 (Loss) income before income taxes (546) 901 1,042 (Benefit) provision for income taxes (383) 210 241 Net (loss) income $ (163) $ 691 $ 801 Net (loss) income per share: $ (1.06) $ 4.39 $ 4.88 Diluted $ (1.06) $ 4.37 $ 4.84 Net Sales [Member] Total revenue $ 15,031 $ 18,885 $ 19,167 Other Revenue (Member) Total revenue $ 924 $ 1,089 $ 1,062 Basic Jan. 30, 2021 Feb. 01, 2020 Variance % $ 2,271 2,590 974 5,835 6,689 2,398 415 15,337 $723 3,537 389 4,649 7,352 2,391 163 14,555 $ 1,548 $ (947) $ 585 $ 1,186 $ (663) $7 $ 252 $ 782 214.11% -26.77% 150.39% 25.51% -9.02% 0.29% 154.60% 5.37% 1,476 1,270 1,206 1,281 $ 270 $ (11) 22.39% -0.86% CONSOLIDATED BALANCE SHEETS - USD ($) $ in Millions Current assets: Cash and cash equivalents Merchandise inventories Other Total current assets Property and equipment, net Operating leases Other assets Total assets Current liabilities: Accounts payable Accrued liabilities Current portion of: Finance lease and financing obligations Operating leases Total current liabilities Long-term debt Finance lease and financing obligations Operating leases Deferred income taxes Other long-term liabilities Shareholders' equity: Common stock - 377 and 375 million shares issued Paid-in capital Treasury stock, at cost, 219 and 219 million shares Retained earnings Total shareholders' equity Total liabilities and shareholders' equity 115 -7.26% 161 3,022 2,451 1,387 2,625 302 124 158 2,769 1,856 1,367 2,619 260 $ (9) $3 $ 253 $ 595 $ 20 $ 6 $ 42 $ 120 1.90% 9.14% 32.06% 1.46% 0.23% 16.15% 51.28% 354 234 4 4 3,319 (11,595) 13,468 5,196 $ 15,337 3,272 (11,571) 13,745 5,450 $ 14,555 $0 $ 47 $ (24) $ (277) $ (254) $ 782 0.00% 1.44% 0.21% -2.02% -4.66% 5.37% 12 Months Ended Feb. 01, 2020 Jan. 30, 2021 Feb. 02, 2019 $ (163) $ 691 $ 801 874 40 18 917 56 51 964 87 (31) 72 64 64 (127) (9) 63 187 149 22 150 11 CONSOLIDATED STATEMENTS OF CASH FLOWS - USD ($) $ in Millions Operating activities Net (loss) income Adjustments to reconcile net (loss) income to net cash provided by operating activities: Depreciation and amortization Share-based compensation Deferred income taxes Impairments, store closing, and other costs (Gain) on sale of real estate (Gain) loss on extinguishment of debt Non-cash inventory costs Non-cash lease expense Other non-cash expense Changes in operating assets and liabilities: Merchandise inventories Other current and long-term assets Accounts payable Accrued and other long-term liabilities Operating lease liabilities Net cash provided by operating activities Investing activities Acquisition of property and equipment Proceeds from sale of real estate Other Net cash used in investing activities Financing activities Proceeds from issuance of debt 18 768 (813) 270 199 (150) 1,338 (51) 48 19 (134) (156) 1,657 79 106 (84) 32 2,107 (855) (578) (334) 197 18 (837) 6 (572) (137) 2,097 (19) (8) (22) (108) (1,497) (470) (31) (423) (6) (396) (34) (400) (943) (46) (126) 36 (105) 9 347 Deferred financing costs Treasury stock purchases Shares withheld for taxes on vested restricted shares Dividends paid Reduction of long-term borrowing Premium paid on redemption of debt Finance lease and financing obligation payments Proceeds from stock option exercises Proceeds from financing obligations Net cash provided by (used in) financing activities Net increase (decrease) in cash and cash equivalents Cash and cash equivalents at beginning of period Cash and cash equivalents at end of period Supplemental information Interest paid, net of capitalized interest Income taxes paid Property and equipment acquired through: Finance lease liabilities Operating lease liabilities Financing obligations (113) 1 11 (1,031) (211) 934 723 1,548 723 2,271 (1,909) (374) 1,308 934 254 193 282 308 419 172 128 37 236 $ 106 $ 165 $ $4 Jan. 30, 2021 100.00% 64.93% Feb. 01, 2020 100.00% 60.78% Feb. 02, 2019 100.00% 60.30% CONSOLIDATED STATEMENTS OF 12 Months Ended OPERATIONS - USD ($) $ in Millions Jan. 30, 2021 Feb. 01, 2020 Feb. 02, 2019 Total revenue $ 15,955 $ 19,974 $ 20,229 Cost of merchandise sold $ 10,360 $ 12,140 $ 12,199 Type of Cost, Good or Service (Extensible List] kss:MerchandisesCost kss:MerchandisesCost kss:Merchandises Member Member CostMember Operating expenses: Selling, general, and administrative $ 5,021 $ 5,705 $ 5,601 Depreciation and amortization 874 917 964 Impairments, store closing, and other costs 89 113 104 (Gain) on sale of real estate (127) Operating (loss) income (262) 1,099 1,361 Interest expense, net 284 207 256 (Gain) loss on extinguishment of debt (9) 63 (Loss) income before income taxes (546) 901 1,042 (Benefit) provision for income taxes (383) 210 241 Net (loss) income $ (163) $ 691 $ 801 Net (loss) income per share: Basic $ (1.06) $4.39 $ 4.88 Diluted $ (1.06) $ 4.37 $ 4.84 Net Sales (Member) Total revenue $ 15,031 $ 18,885 $ 19,167 Other Revenue (Member) Total revenue $ 924 $1,089 $ 1,062 31.47% 5.48% 0.56% -0.80% -1.64% 1.78% 0.00% -3.42% -2.40% -1.02% 28.56% 4.59% 0.57% 0.00% 5.50% 1.04% -0.05% 4.51% 1.05% 3.46% 27.69% 4.77% 0.51% 0.00% 6.73% 1.27% 0.31% 5.15% 1.19% 3.96% % 12 Months Ended Variance $ (4,019) $ (1,780) Feb. 02, 2019 -20.12% $ 20,229 -14.66% $ 12,199 kss:Merchandises CostMember $ 5,601 964 104 CONSOLIDATED STATEMENTS OF OPERATIONS - USD ($) $ in Millions Jan. 30, 2021 Feb. 01, 2020 Total revenue $ 15,955 $ 19,974 Cost of merchandise sold $ 10,360 $ 12,140 Type of Cost, Good or Service (Extensible List] kss:MerchandisesCost kss:MerchandisesCost Member Member Operating expenses: Selling, general, and administrative $ 5,021 $ 5,705 Depreciation and amortization 874 917 Impairments, store closing, and other costs 89 113 (Gain) on sale of real estate (127) Operating (loss) income (262) 1,099 Interest expense, net 284 207 (Gain) loss on extinguishment of debt (9) (Loss) income before income taxes (546) 901 (Benefit) provision for income taxes (383) 210 Net (loss) income $ (163) $ 691 Net (loss) income per share: Basic $ (1.06) $4.39 Diluted $ (1.06) $ 4.37 Net Sales (Member) Total revenue $ 15,031 $ 18,885 Other Revenue (Member) Total revenue $ 924 $ 1,089 $ (684) $ (43) $ (24) $ (127) $ (1,361) $77 $ 9 $ (1,447) $ (593) $ (854) -11.99% -4.69% -21.24% #DIV/0! -123.84% 37.20% -100.00% -160.60% -282.38% -123.59% 1,361 256 63 1,042 241 $ 801 $ 4.88 $ 4.84 $ 19,167 $ 1,062