Question
Analyze and show the result of this python program: from matplotlib import pyplot as plt [1950, 1960, 1970, 1980, 1990, 2000, 2010] gdp [300.2,

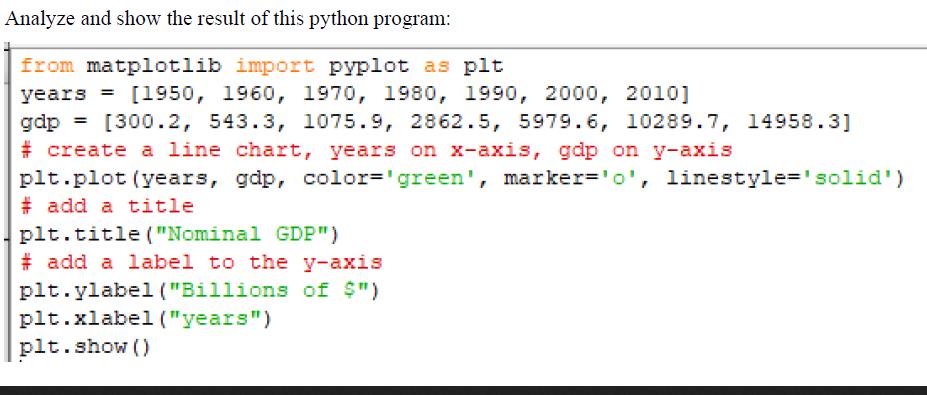
Analyze and show the result of this python program: from matplotlib import pyplot as plt [1950, 1960, 1970, 1980, 1990, 2000, 2010] gdp [300.2, 543.3, 1075.9, 2862.5, 5979.6, 10289.7, 14958.3] # create a line chart, years on x-axis, gdp on y-axis plt.plot(years, gdp, color='green', marker='0', linestyle='solid') # add a title plt.title ("Nominal GDP") # add a label to the y-axis plt.ylabel("Billions of $") plt.xlabel ("years") plt.show()
Step by Step Solution
There are 3 Steps involved in it
Step: 1
Step 1 Matplotlib is a library which allows programmers to draw graph in python programming l...
Get Instant Access to Expert-Tailored Solutions
See step-by-step solutions with expert insights and AI powered tools for academic success
Step: 2

Step: 3

Ace Your Homework with AI
Get the answers you need in no time with our AI-driven, step-by-step assistance
Get StartedRecommended Textbook for
Macroeconomics
Authors: Stephen d. Williamson
5th Canadian edition
133847144, 9780134604794 , 978-0133847147
Students also viewed these Programming questions
Question
Answered: 1 week ago
Question
Answered: 1 week ago
Question
Answered: 1 week ago
Question
Answered: 1 week ago
Question
Answered: 1 week ago
Question
Answered: 1 week ago
Question
Answered: 1 week ago
Question
Answered: 1 week ago
Question
Answered: 1 week ago
Question
Answered: 1 week ago
Question
Answered: 1 week ago
Question
Answered: 1 week ago
Question
Answered: 1 week ago
Question
Answered: 1 week ago
Question
Answered: 1 week ago
Question
Answered: 1 week ago
Question
Answered: 1 week ago
Question
Answered: 1 week ago
Question
Answered: 1 week ago
Question
Answered: 1 week ago
Question
Answered: 1 week ago
View Answer in SolutionInn App


