Question
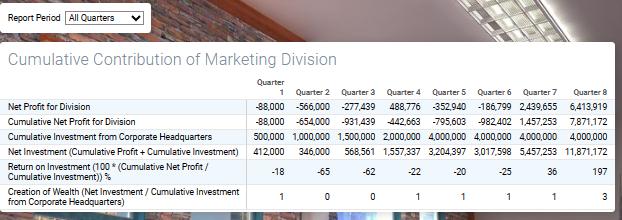
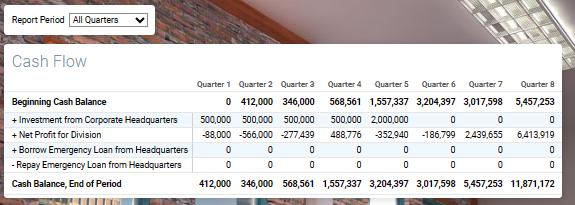
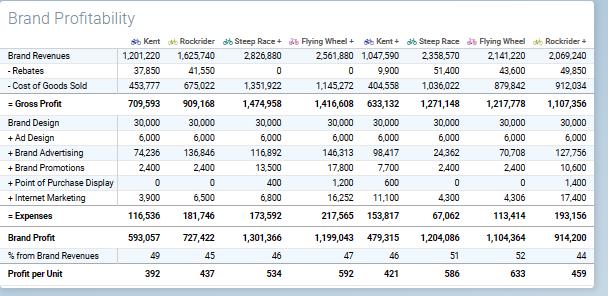
Analyze below data and provide a feedback Do a performance analysis of the company Do a ratio analysis of the company (show the calculation as
- Analyze below data and provide a feedback
- Do a performance analysis of the company
- Do a ratio analysis of the company (show the calculation as well)
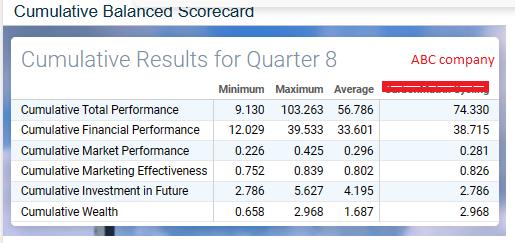
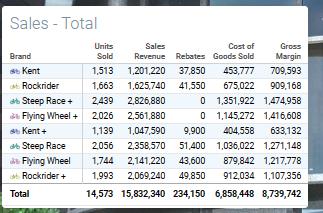
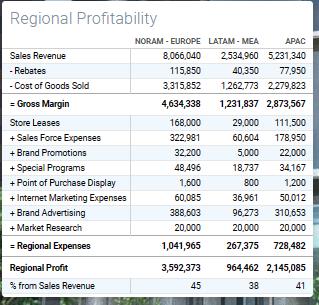
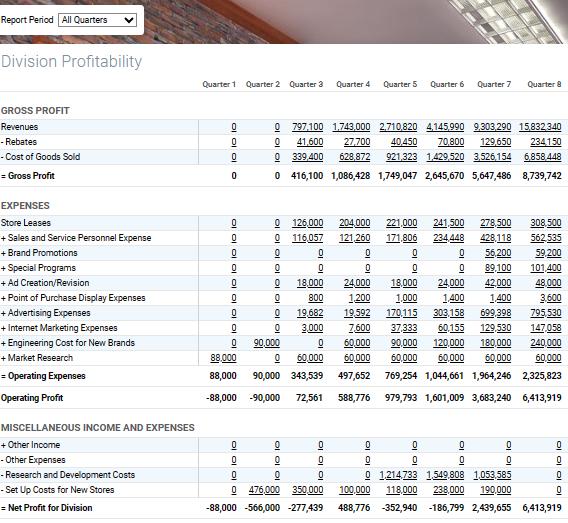
Cumulative Balanced Scorecard Cumulative Results for Quarter 8 Minimum Maximum Average ABC company Cumulative Total Performance Cumulative Financial Performance 9.130 103.263 56.786 74.330 12.029 39.533 33.601 38.715 Cumulative Market Performance 0.226 0.425 0.296 0.281 Cumulative Marketing Effectiveness 0.752 0.839 0.802 0.826 Cumulative Investment in Future 2.786 5.627 4.195 2.786 Cumulative Wealth 0.658 2.968 1.687 2.968
Step by Step Solution
There are 3 Steps involved in it
Step: 1

Get Instant Access to Expert-Tailored Solutions
See step-by-step solutions with expert insights and AI powered tools for academic success
Step: 2

Step: 3

Ace Your Homework with AI
Get the answers you need in no time with our AI-driven, step-by-step assistance
Get StartedRecommended Textbook for
Cost Management Measuring Monitoring And Motivating Performance
Authors: Leslie G. Eldenburg, Susan Wolcott, Liang Hsuan Chen, Gail Cook
2nd Canadian Edition
1118168879, 9781118168875
Students also viewed these General Management questions
Question
Answered: 1 week ago
Question
Answered: 1 week ago
Question
Answered: 1 week ago
Question
Answered: 1 week ago
Question
Answered: 1 week ago
Question
Answered: 1 week ago
Question
Answered: 1 week ago
Question
Answered: 1 week ago
Question
Answered: 1 week ago
Question
Answered: 1 week ago
Question
Answered: 1 week ago
Question
Answered: 1 week ago
Question
Answered: 1 week ago
Question
Answered: 1 week ago
Question
Answered: 1 week ago
Question
Answered: 1 week ago
Question
Answered: 1 week ago
Question
Answered: 1 week ago
Question
Answered: 1 week ago
Question
Answered: 1 week ago
Question
Answered: 1 week ago
Question
Answered: 1 week ago
View Answer in SolutionInn App


