Answered step by step
Verified Expert Solution
Question
1 Approved Answer
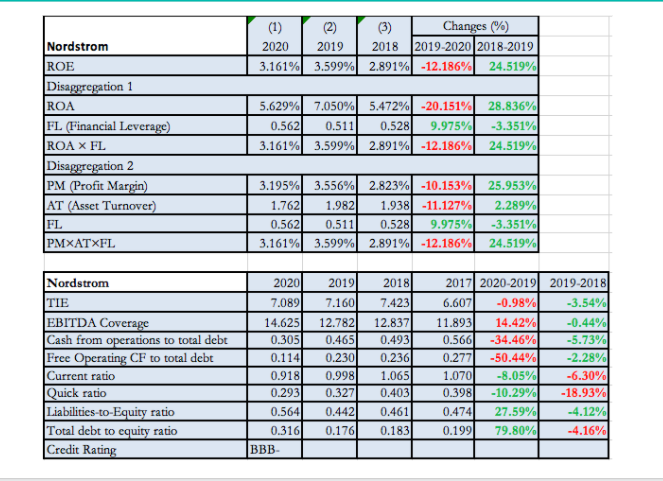
Analyze credit risk in the past and current years Analyze profitability in the past and current years (2) Changes (%) 2020 2019 2018 2019-2020 2018-2019

Analyze credit risk in the past and current years
Analyze profitability in the past and current years
(2) Changes (%) 2020 2019 2018 2019-2020 2018-2019 3.161% 3.599% 2.891% -12.186%| 24.519% Nordstrom ROE Disaggregation 1 ROA FL (Financial Leverage) ROA X FL Disaggregation 2 PM (Profit Margin) AT (Asset Turnover) 5.629% 7.050% 5.472% -20.151% 0.562 0.511 0.528 9.975% 3.161% 3.599% 2.891% -12.186% 28.836% -3.351% 24.519% 3.195% 3.556% 2.823% -10.153% 25.953% 1.762 1.982 1.938 -11.127% 2.289% 0.562 0.511 0.528 9.975% -3.351% 3.161% 3.599% 2.891% -12.186% 24.519% FL PMXATXFL 2020 2018 2019 7.160 Nordstrom TIE EBITDA Coverage Cash from operations to total debt Free Operating CF to total debt Current ratio Quick ratio Liabilities-to-Equity ratio Total debt to equity ratio Credit Rating 7.089 14.625 0.305 0.114 0.918 0.293 0.564 0.316 12.782 0.465 0.230 0.998 0.327 0.442 0.176 7.423 12.837 0.493 0.236 1.065 0.403 0.461 0.183 2017 2020-2019 2019-2018 6.607 -0.98% -3.54% 11.893 14.42% -0.44% 0.566 -34.46% -5.73% 0.277 -50.44% -2.28% 1.070 -8.05% -6.30% 0.3981 -10.29% -18.93% 0.474 27.59% -4.12% 0.1991 79.80% -4.16% BBBStep by Step Solution
There are 3 Steps involved in it
Step: 1

Get Instant Access to Expert-Tailored Solutions
See step-by-step solutions with expert insights and AI powered tools for academic success
Step: 2

Step: 3

Ace Your Homework with AI
Get the answers you need in no time with our AI-driven, step-by-step assistance
Get Started


