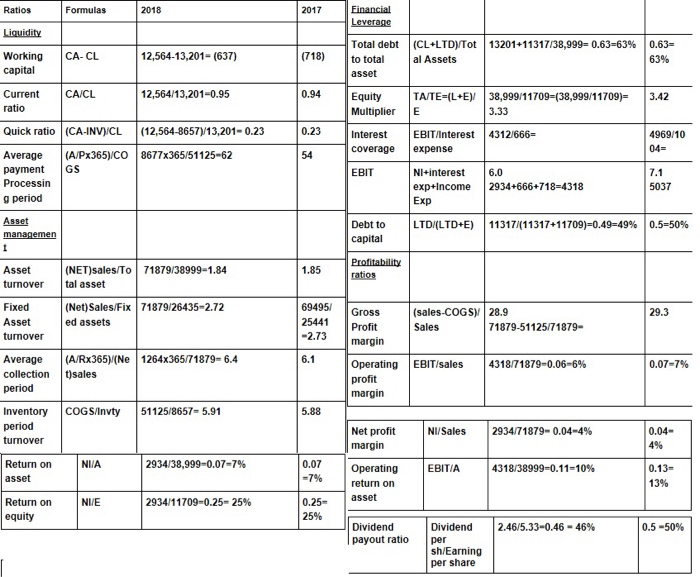
analyze financial ratios and explain the changes that occured in 2018 compared to 2017
any significant changes?
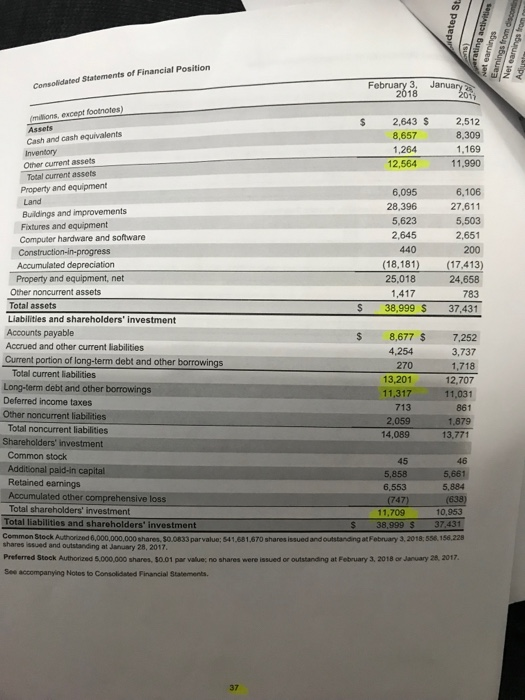
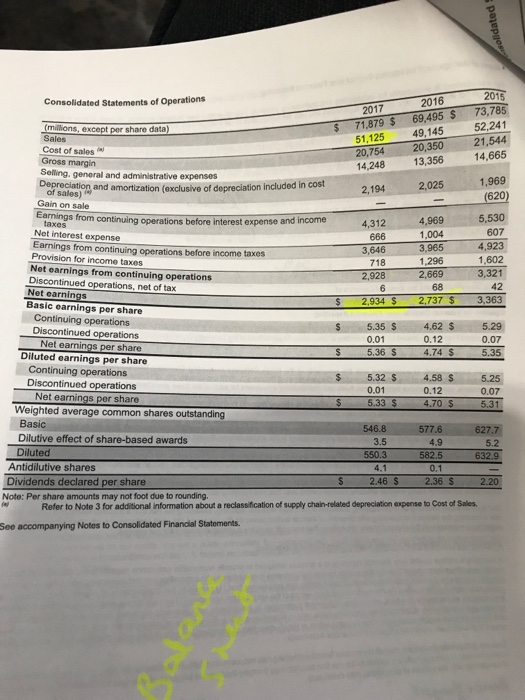
Ratios Formulas 2018 17 Financial Total debt to total asset | (CL+LTD)/Tot | 13201 +11317/38,999-0.63-63% Working CA-CIL capital (718) total | 0.63- 63% 12,564-13,201- (637) al Assets Current CA/CL ratio 12,564/13,201-0.95 0.94 Equity Multiplier E TATE (L+E 38,999/11709-(38,999/11709)3.42 3.33 Quick ratio (CA-INVICL (12,564-8657) 13,201-0.23 0.23 Interest EBIT/Interest 43121666- coverage expense 4969/10 Average (A/Px365)/CO 8677x365/51125-62 payment GS Processin g period 54 EBIT NI+interest 6.0 exp+Income 2934+666+718-4318 Exp 7.1 5037 Asset Debt to capital | LTD/(LTD+E) | 11317/(11317+1 1709)-0.49-49% | 0.5-50% Asset (NET)sales/To 71879/38999-1.84 1.85 turnover tal asset Fixed Asset 69495 Gross 2544 Profit 2.73 margin 6.1 (Net) Sales Fix 71879/26435-2.72 ed assets (sales-COGS 28.9 Sales 29.3 71879-51125/71879- Average (A/Rx365 (Ne 1264x365/71879-6.4 collectiont)sales period Operating profit margin | EBIT/sales | 431871879-0.06-6% 0.07-7% Inventory COGS/Invty 51125/8657-5.91 period 5.88 Net profit NI/Sales margin 2934/71879-0.04-4% 0.04- NI/A Return on asset Return on equity 2934/38,999-0.07-7% Operating EBITIA return on 0.13- 13% 431838999-0.1 1-10% 0.25 asset 25% NI/E 2934/11709-0.25-25% Dividend24 2.46/5.33-0.46-46% 0.5-50% payout ratio per sh/Earning per share of Financial Position Statements February 3, Janua millions, except footnotes) $ 2,643 $ 2,512 8,309 1.169 11,990 8,657 1,264 12,564 equivalents Cash and cash Other current assets Total current assets Property and equipment 6,095 28,396 5,623 2,645 6,106 27,611 5,503 2,651 Buildings and improvements Fixtures and equipment Computer hardware and software 440 200 Construction-in-progress Accumulated depreciation (18,181) (17,413) Property and equipment, net Other noncurrent assets Total assets Liabilities and shareholders' investment Accounts payable 24,658 783 S 38,999 $ 37,431 25,018 1,417 $ 8,677 $ 7,252 3,737 Accrued and other current liabilities 4,254 270 13,201 11,317 713 2,059 14,089 Current portion of long-term debt and other borrowings Total current liabilities Long-term debt and other borrowings Deferred income taxes 12,707 861 1,879 13,771 t liabilities Total noncurrent liabilities Common stock Additional paid-in capital Retained earnings Accumulated other comprehensive loss Total shareholders' investment 45 5,858 6,553 5,661 5,884 11,709 38,999 S 3743 10,953 Total liabilities and shareholders' investment Common Stock Authorized 6,000,000,000 shares, $0.0833 parvalue: 541,681,670 shares issued and outstanding at February 3, 2018;556.156.228 shares issued and outstanding at January 28, 2017 Preferred Stock Authorized 5,000,000 shares, 50.01 par value; no shares were issued or outstanding at February 3, 2018 or January 28, 2017 See accompanying Notos to Consolidated Financial Statements. 37 2015 5 52,241 Consolidated Statements of Operations 2016 2017 71,879 $ 69,495 73,78 Sales Cost of sales Gross margin Seling, general and administrative expenses 49,145 20,754 20,350 14,248 13,356 2,025 51,125 21,544 14,665 1,969 620 of sales)and amortization (exclusive of depreciation included in cost 2,194 Gain on sale mings from continuing operations before interest expense and income 4,969 1,004 3,965 1,296 2,669 68 5,530 607 4,923 1,602 3,321 42 737 $ 3,363 taxes 4,312 Net interest expense Earnings from continuing operations before income taxes Not earnings from continuing operations Net earnings 3,646 718 2,928 Provision for income taxes 2934 S Basic earnings per share Continuing operations Discontinued operations S 5.35 S 4.62 $ 5.29 0.07 5.35 0.01 5.36 $ Net earnings per share Diluted earnings per share 4.74 $ Continuing operations Discontinued operations Net earnings per share $ 5.32 S 4.58 S 5.25 0.07 5.31 0.01 5.33 0.12 4.70 S Weighted average common shares outstanding Basic Dilutive effect of share-based awards Diluted 546.8577.6627.7 5.2 632.9 3.5 Antidilutive shares 0.1 Dividends declared per share $ 2.46 $ 2.20 Note: Per share amounts may not foot due to rounding Refer to Note 3 for additional information about a reclassification of supply chain-related depreciation expense to Cost of Sales See accompanying Notes to Consolidated Financial Statements