- Analyze financial report for chosen company and state the condition of the company. Your analysis must consists all ratio analysis for all 3 years
INDUSTRY AVERAGE RATIO
| Current ratio | 1.65 x | Average collection period | 160 Days |
| Quick ratio | 1.32 x | Inventory turnover | 1.30 x |
| Debt ratio | 40% | Return on assets | 9.56% |
| Time interest earned | 7.9 x | Net profit margin | 22% |
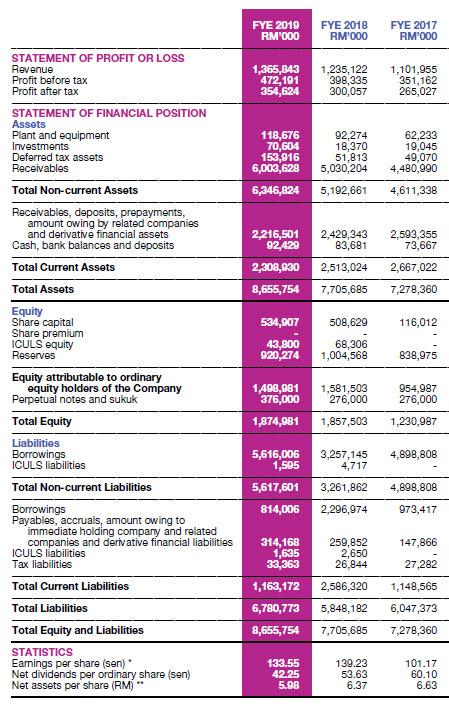
FE 2019 RM'000 EYE 2018 RM'000 EYE 2017 RM'000 1,365,843 472,191 354,624 1,235,122 398,335 300,057 1,101,955 351,162 265,027 118,676 70,604 153,916 6,003,628 92,274 18,370 51,813 5,030,204 62,233 19,045 49,070 4,480,990 4,611,338 6,346,824 5,192,661 2,593,355 73,667 2,216,501 92,429 2,308,830 8,655,754 2,429,343 83,681 2,513,024 2,667,022 7,278,360 7,705,685 534,907 508,629 116,012 43,800 920,274 68,306 1,004,568 838,975 STATEMENT OF PROFIT OR LOSS Revenue Profit before tax Profit after tax STATEMENT OF FINANCIAL POSITION Assets Plant and equipment Investments Deferred tax assets Receivables Total Non-current Assets Receivables, deposits, prepayments, amount owing by related companies and derivative financial assets Cash, bank balances and deposits Total Current Assets Total Assets Equity Share capital Share premium ICULS equity Reserves Equity attributable to ordinary equity holders of the Company Perpetual notes and sukuk Total Equity Liabilities Borrowings ICULS liabilities Total Non-current Liabilities Borrowings Payables, accruals, amount owing to immediate holding company and related companies and derivative financial liabilities ICULS liabilities Tax liabilities Total Current Liabilities Total Liabilities Total Equity and Liabilities STATISTICS Earnings per share (sen) Net dividends per ordinary share (sen) Net assets per share (RM) 1,498,981 376,000 1,581,503 276,000 954,987 276,000 1,874,981 1,857,503 1,230,987 3,257,145 4,717 4,898,808 5,616,006 1,505 5,617,601 814,006 3,261,862 4,898,808 2,296,974 973,417 259,852 2,650 26,844 147,866 27,282 314,168 1,635 33,363 1,163,172 6,780,773 8,655,754 2,586,320 1,148,565 5,848,182 6,047,373 7,278,360 7,705,685 133.55 42.25 5.98 139.23 53.63 6.37 101.17 60.10 6.63 de FE 2019 RM'000 EYE 2018 RM'000 EYE 2017 RM'000 1,365,843 472,191 354,624 1,235,122 398,335 300,057 1,101,955 351,162 265,027 118,676 70,604 153,916 6,003,628 92,274 18,370 51,813 5,030,204 62,233 19,045 49,070 4,480,990 4,611,338 6,346,824 5,192,661 2,593,355 73,667 2,216,501 92,429 2,308,830 8,655,754 2,429,343 83,681 2,513,024 2,667,022 7,278,360 7,705,685 534,907 508,629 116,012 43,800 920,274 68,306 1,004,568 838,975 STATEMENT OF PROFIT OR LOSS Revenue Profit before tax Profit after tax STATEMENT OF FINANCIAL POSITION Assets Plant and equipment Investments Deferred tax assets Receivables Total Non-current Assets Receivables, deposits, prepayments, amount owing by related companies and derivative financial assets Cash, bank balances and deposits Total Current Assets Total Assets Equity Share capital Share premium ICULS equity Reserves Equity attributable to ordinary equity holders of the Company Perpetual notes and sukuk Total Equity Liabilities Borrowings ICULS liabilities Total Non-current Liabilities Borrowings Payables, accruals, amount owing to immediate holding company and related companies and derivative financial liabilities ICULS liabilities Tax liabilities Total Current Liabilities Total Liabilities Total Equity and Liabilities STATISTICS Earnings per share (sen) Net dividends per ordinary share (sen) Net assets per share (RM) 1,498,981 376,000 1,581,503 276,000 954,987 276,000 1,874,981 1,857,503 1,230,987 3,257,145 4,717 4,898,808 5,616,006 1,505 5,617,601 814,006 3,261,862 4,898,808 2,296,974 973,417 259,852 2,650 26,844 147,866 27,282 314,168 1,635 33,363 1,163,172 6,780,773 8,655,754 2,586,320 1,148,565 5,848,182 6,047,373 7,278,360 7,705,685 133.55 42.25 5.98 139.23 53.63 6.37 101.17 60.10 6.63 de