Answered step by step
Verified Expert Solution
Question
1 Approved Answer
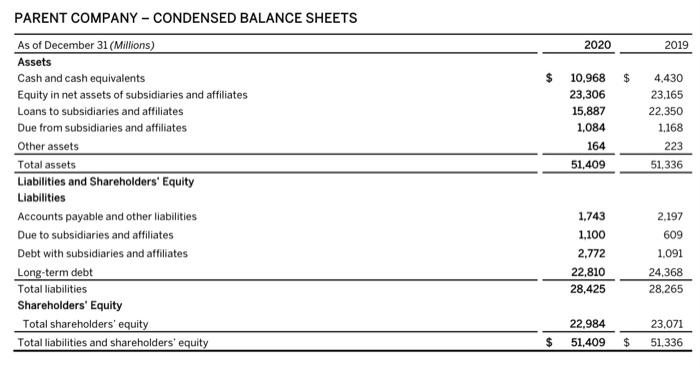
Analyze firm's performance by using Vertical (Common size) method: 2020 2019 $ $ 10,968 23,306 15,887 1,084 164 51,409 4.430 23.165 22,350 1.168 223 51,336
Analyze firm's performance by using Vertical (Common size) method: 

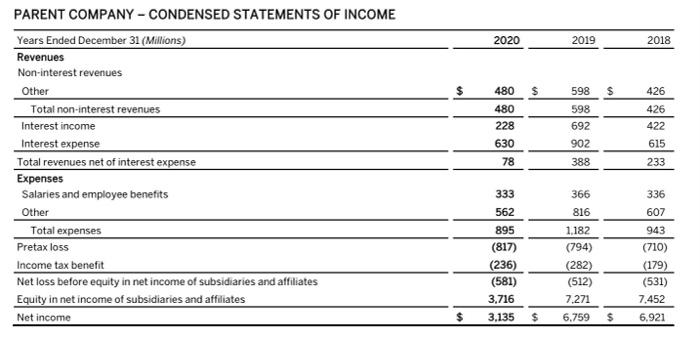
2020 2019 $ $ 10,968 23,306 15,887 1,084 164 51,409 4.430 23.165 22,350 1.168 223 51,336 PARENT COMPANY - CONDENSED BALANCE SHEETS As of December 31 (Millions) Assets Cash and cash equivalents Equity in net assets of subsidiaries and affiliates Loans to subsidiaries and affiliates Due from subsidiaries and affiliates Other assets Total assets Liabilities and Shareholders' Equity Liabilities Accounts payable and other liabilities Due to subsidiaries and affiliates Debt with subsidiaries and affiliates Long-term debt Total liabilities Shareholders' Equity Total shareholders' equity Total liabilities and shareholders' equity 2.197 609 1.743 1.100 2.772 22.810 28,425 1.091 24,368 28,265 23.071 22,984 51,409 $ $ 51,336 2020 2019 2018 $ 598 $ 426 480 480 228 630 78 598 692 902 PARENT COMPANY - CONDENSED STATEMENTS OF INCOME Years Ended December 31 (Millions) Revenues Non-interest revenues Other Total non-interest revenues Interest income Interest expense Total revenues net of interest expense Expenses Salaries and employee benefits Other Total expenses Pretax loss Income tax benefit Net loss before equity in net income of subsidiaries and affiliates Equity in net income of subsidiaries and affiliates Net income 426 422 615 388 233 366 336 333 562 895 (817) (236) (581) 3,716 3.135 816 1.182 (794) (282) (512) 7.271 607 943 (710) (179) (531) 7.452 $ $ 6.759 $ 6.921 

Step by Step Solution
There are 3 Steps involved in it
Step: 1

Get Instant Access to Expert-Tailored Solutions
See step-by-step solutions with expert insights and AI powered tools for academic success
Step: 2

Step: 3

Ace Your Homework with AI
Get the answers you need in no time with our AI-driven, step-by-step assistance
Get Started


