Analyze purchase of home with various types of financing

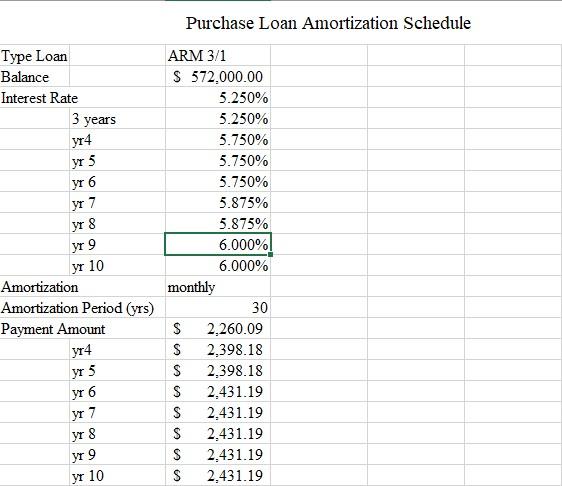
ARM Loans Payment Changes Annually after fixed period Minimum payment due will be an amount that will not exceed 7.5% more of less that the last minimum monthly payment due before the rate change
Interest Rate Limit: 9.95% Interest Rate Changes Annually with payment change Negative Amortization None
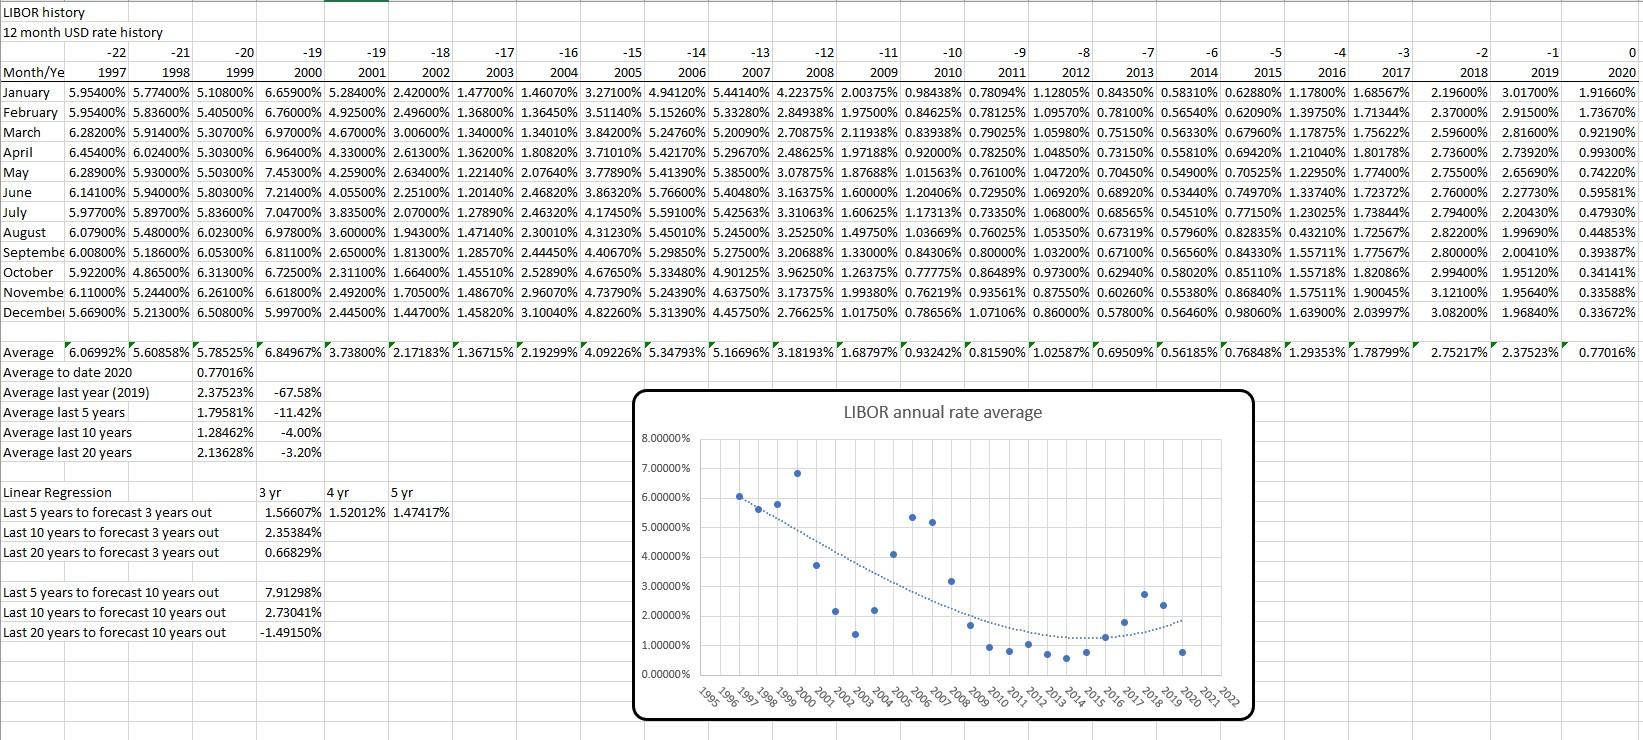
Index Beginning on the first interest rate change, interest will be computed based on the index. The index is the twelve (12) month average of the monthly average annual yield of the 1 year LIBOR rate. The most recent index available and the twelve months preceding will be used in the calculation
Calculation of Interest Rate Changes The new annual interest rate will be the sum of the margin and average annual index computed for each adjustment period, rounded to the nearest 0.125%
Underwriting Criteria

 Compute and Describe for each loan: 4. Effective Interest Rate held through holding period 5. Loan balance at end of holding period 6. Annual holding costs
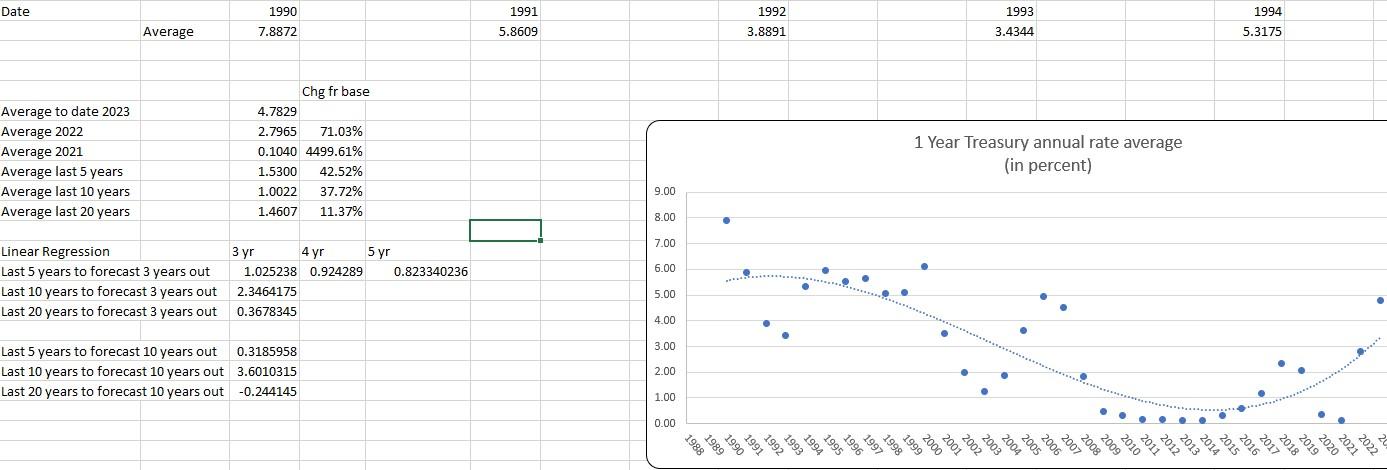
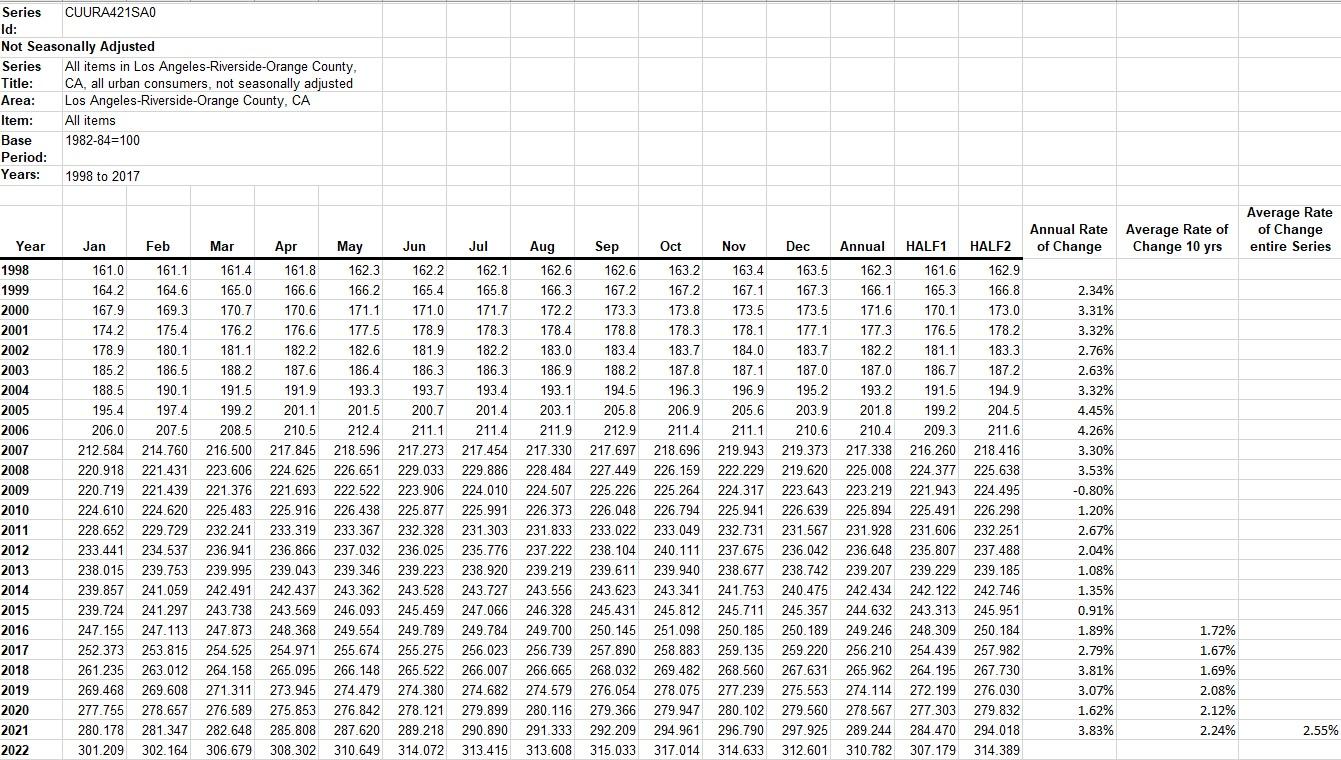
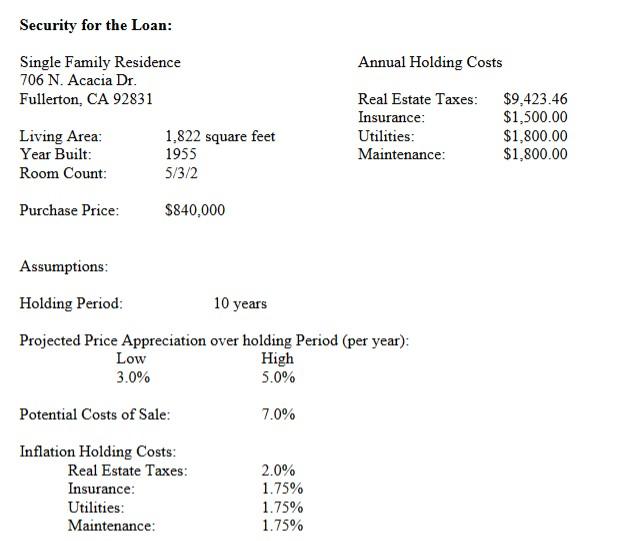
Loans Offered \begin{tabular}{|c|c|c|c|c|c|c|c|c|} \hline Type & Term & Rate & Amortization & Points & Origination Fees & Index & Margin \\ \hline Fixed & 15 & 5.250% & Monthly & 1.651% & $85 & 0 & 0.00% \\ \hline Fixed & 30 & 6.250% & Monthly & 0.000% & $995 & 0 & 0.00% \\ \hline ARM 3/1 & 30 & 5.250% & Monthly & 0.0% & $105 & 1 yr Treasury & 2.75% \\ \hline ARM 5/1 & 30 & 5.375% & Monthly & 0.000% & $995 & 1 yr Treasury & 2.75% \\ \hline ARM 7/1 & 30 & 5.500% & Monthly & 0.000% & $105 & 1 yr Treasury & 2.75% \\ \hline & & & & & & \\ \hline All Loans & Conventional & LTV & 80.0% & & & \\ \hline \end{tabular} \begin{tabular}{|l|r|r|} \hline & \multicolumn{1}{|c|}{ Low } & \multicolumn{2}{|c|}{ High } \\ \hline Debt to Income Ratio (PITI) & 37.0% & 42.0% \\ \hline Add'I Long Term Debt to Income & & 45.0% \\ \hline \end{tabular} Security for the Loan: Assumptions: Holding Period: 10 years Projected Price Appreciation over holding Period (per year): Low3.0%High5.0% Potential Costs of Sale: 7.0% Inflation Holding Costs: Real Estate Taxes: 2.0% Insurance: 1.75% Utilities: 1.75% Maintenance: 1.75% Dirohaca T ann Amortization Cohadila Date Average \begin{tabular}{|r|r|r|r|r|r|r|r|} \hline 1990 & 1991 & 1992 & 1993 \\ \hline 7.8872 & 5.8609 & 3.8891 & 3.4344 \\ \hline \end{tabular} Chg fr base Average to date 2023 4.7829 Average 2022 2.796571.03% Average 2021 1 Year Treasury annual rate average Average last 5 years \begin{tabular}{r|r|} \hline 0.1040 & 4499.61% \\ \hline 1.5300 & 42.52% \\ \hline \end{tabular} (in percent) Average last 10 years Average last 20 years \begin{tabular}{|l|l} \hline 1.0022 & 37.72% \\ \hline 1.4607 & 11.37% \end{tabular} Linear Regression 3yr4yr5yr \begin{tabular}{|l|r|r|r|} \hline Last 5 years to forecast 3 years out & 1.025238 & 0.924289 & 0.823340236 \\ \hline \end{tabular} Last 10 years to forecast 3 years out 2.3464175 Last 20 years to forecast 3 years out 0.3678345 Last 5 years to forecast 10 years out 0.3185958 Last 10 years to forecast 10 years out 3.6010315 Last 20 years to forecast 10 years out -0.244145 Series CUURA421SA0 Id: Not Seasonally Adjusted Series All items in Los Angeles-Riverside-Orange County, Title: CA, all urban consumers, not seasonally adjusted Area: Los Angeles-Riverside-Orange County, CA Item: All items Base 198284=100 Period: Years: 1998 to 2017 Loans Offered \begin{tabular}{|c|c|c|c|c|c|c|c|c|} \hline Type & Term & Rate & Amortization & Points & Origination Fees & Index & Margin \\ \hline Fixed & 15 & 5.250% & Monthly & 1.651% & $85 & 0 & 0.00% \\ \hline Fixed & 30 & 6.250% & Monthly & 0.000% & $995 & 0 & 0.00% \\ \hline ARM 3/1 & 30 & 5.250% & Monthly & 0.0% & $105 & 1 yr Treasury & 2.75% \\ \hline ARM 5/1 & 30 & 5.375% & Monthly & 0.000% & $995 & 1 yr Treasury & 2.75% \\ \hline ARM 7/1 & 30 & 5.500% & Monthly & 0.000% & $105 & 1 yr Treasury & 2.75% \\ \hline & & & & & & \\ \hline All Loans & Conventional & LTV & 80.0% & & & \\ \hline \end{tabular} \begin{tabular}{|l|r|r|} \hline & \multicolumn{1}{|c|}{ Low } & \multicolumn{2}{|c|}{ High } \\ \hline Debt to Income Ratio (PITI) & 37.0% & 42.0% \\ \hline Add'I Long Term Debt to Income & & 45.0% \\ \hline \end{tabular} Security for the Loan: Assumptions: Holding Period: 10 years Projected Price Appreciation over holding Period (per year): Low3.0%High5.0% Potential Costs of Sale: 7.0% Inflation Holding Costs: Real Estate Taxes: 2.0% Insurance: 1.75% Utilities: 1.75% Maintenance: 1.75% Dirohaca T ann Amortization Cohadila Date Average \begin{tabular}{|r|r|r|r|r|r|r|r|} \hline 1990 & 1991 & 1992 & 1993 \\ \hline 7.8872 & 5.8609 & 3.8891 & 3.4344 \\ \hline \end{tabular} Chg fr base Average to date 2023 4.7829 Average 2022 2.796571.03% Average 2021 1 Year Treasury annual rate average Average last 5 years \begin{tabular}{r|r|} \hline 0.1040 & 4499.61% \\ \hline 1.5300 & 42.52% \\ \hline \end{tabular} (in percent) Average last 10 years Average last 20 years \begin{tabular}{|l|l} \hline 1.0022 & 37.72% \\ \hline 1.4607 & 11.37% \end{tabular} Linear Regression 3yr4yr5yr \begin{tabular}{|l|r|r|r|} \hline Last 5 years to forecast 3 years out & 1.025238 & 0.924289 & 0.823340236 \\ \hline \end{tabular} Last 10 years to forecast 3 years out 2.3464175 Last 20 years to forecast 3 years out 0.3678345 Last 5 years to forecast 10 years out 0.3185958 Last 10 years to forecast 10 years out 3.6010315 Last 20 years to forecast 10 years out -0.244145 Series CUURA421SA0 Id: Not Seasonally Adjusted Series All items in Los Angeles-Riverside-Orange County, Title: CA, all urban consumers, not seasonally adjusted Area: Los Angeles-Riverside-Orange County, CA Item: All items Base 198284=100 Period: Years: 1998 to 2017


 Compute and Describe for each loan: 4. Effective Interest Rate held through holding period 5. Loan balance at end of holding period 6. Annual holding costs


