

Answered step by step
Verified Expert Solution
Question
1 Approved Answer
Analyze Salesforce Stocks over the past 3 months include key points Charting Fullscreen CRM 1D 5D 1M 3M 6M YTD 1Y 3Y 5Y 10Y DAILY
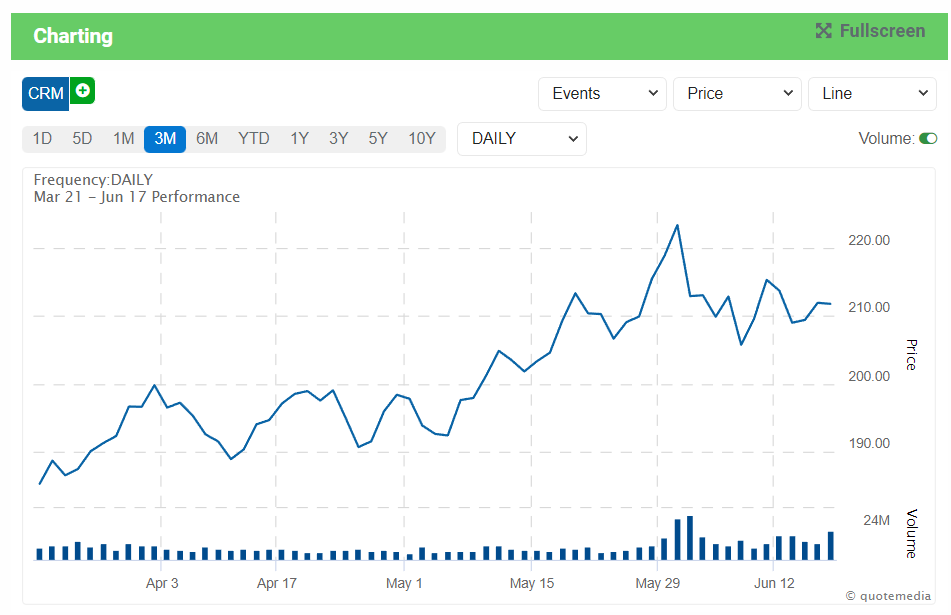
Analyze Salesforce Stocks over the past 3 months include key points
Charting Fullscreen CRM 1D 5D 1M 3M 6M YTD 1Y 3Y 5Y 10Y DAILY Volume: Frequency:DAILY Mar 21 - Jun 17 PerformanceStep by Step Solution
There are 3 Steps involved in it
Step: 1

Get Instant Access to Expert-Tailored Solutions
See step-by-step solutions with expert insights and AI powered tools for academic success
Step: 2

Step: 3
Ace Your Homework with AI
Get the answers you need in no time with our AI-driven, step-by-step assistance
Get Started
The Finance Book
Authors: Stuart Warner, Si Hussain
2nd Edition
1292401982, 978-1292401980