

Answered step by step
Verified Expert Solution
Question
1 Approved Answer
Analyze the data in the following problems using median and up/down run tests with z = 2. a. Given the following run test results
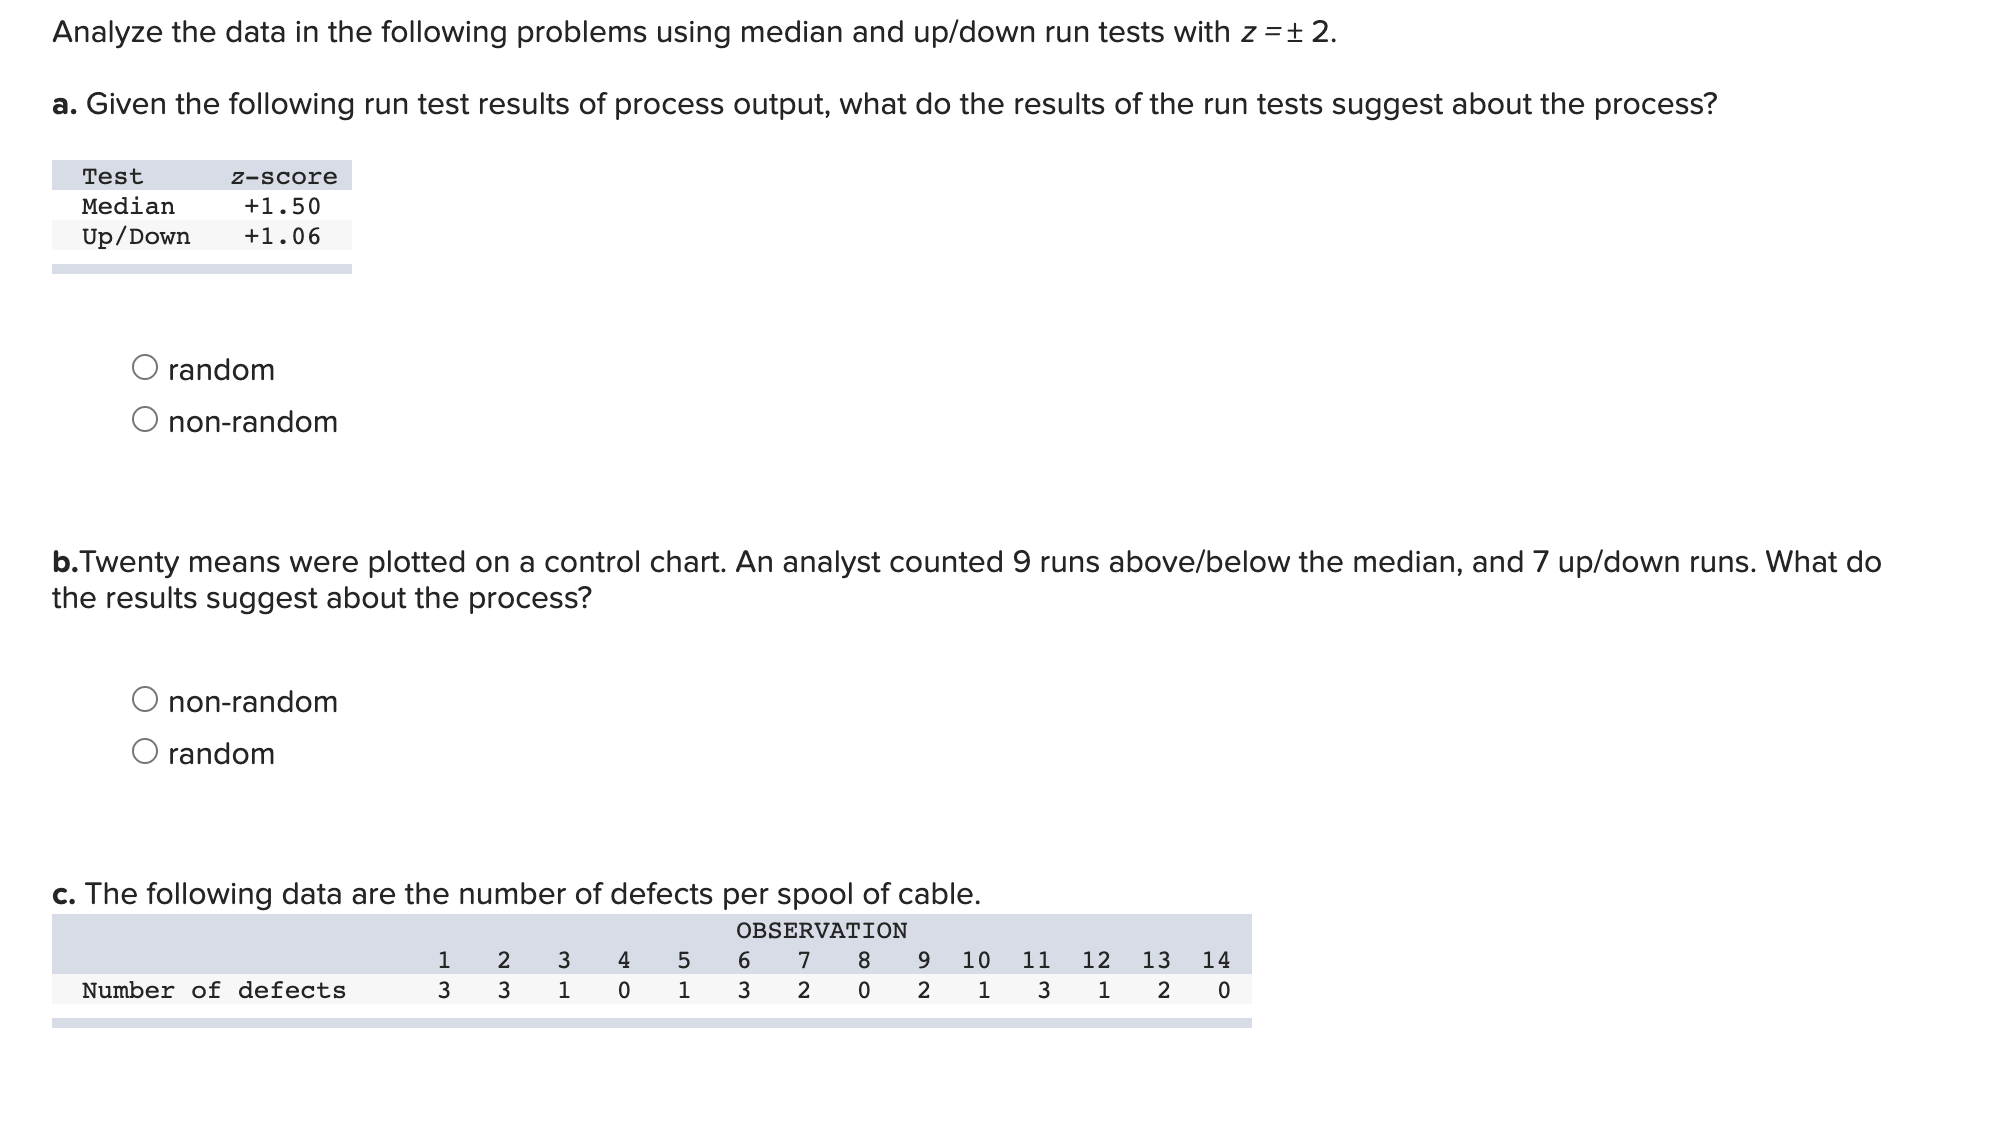
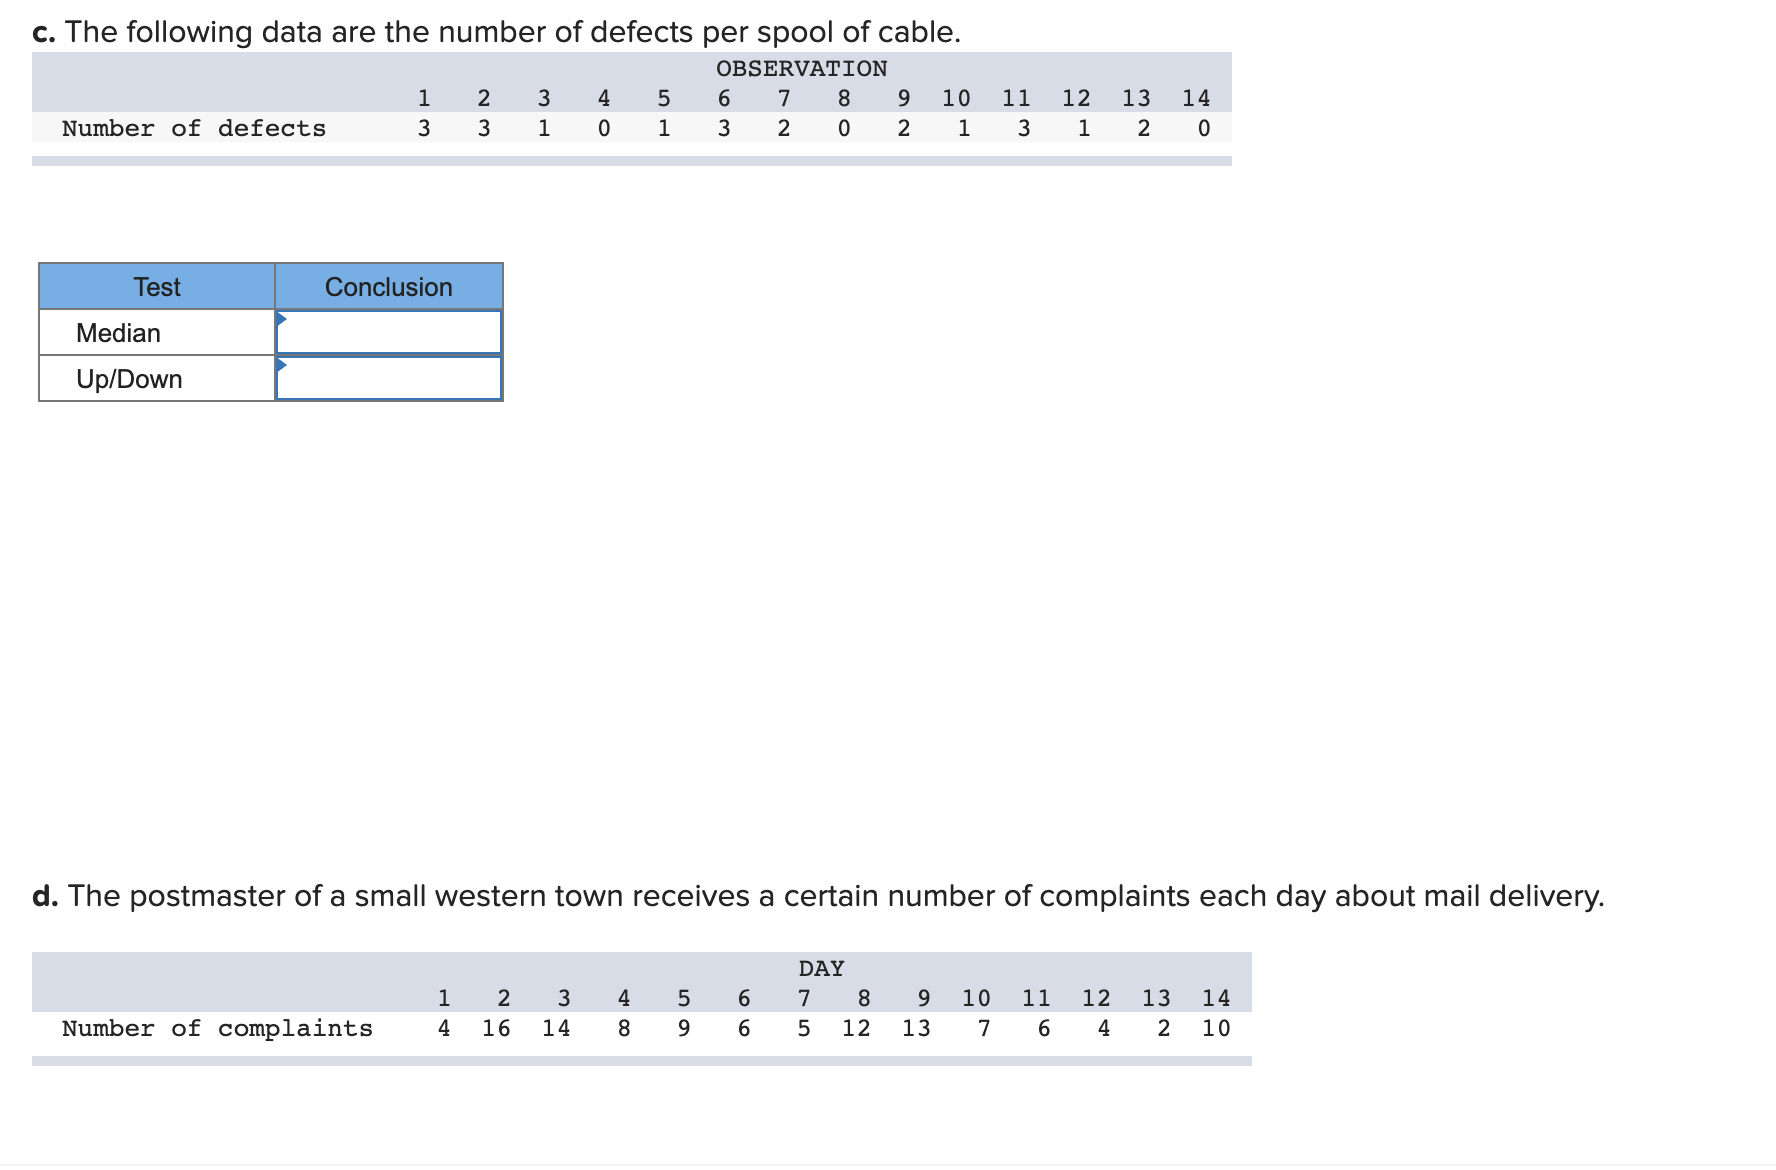
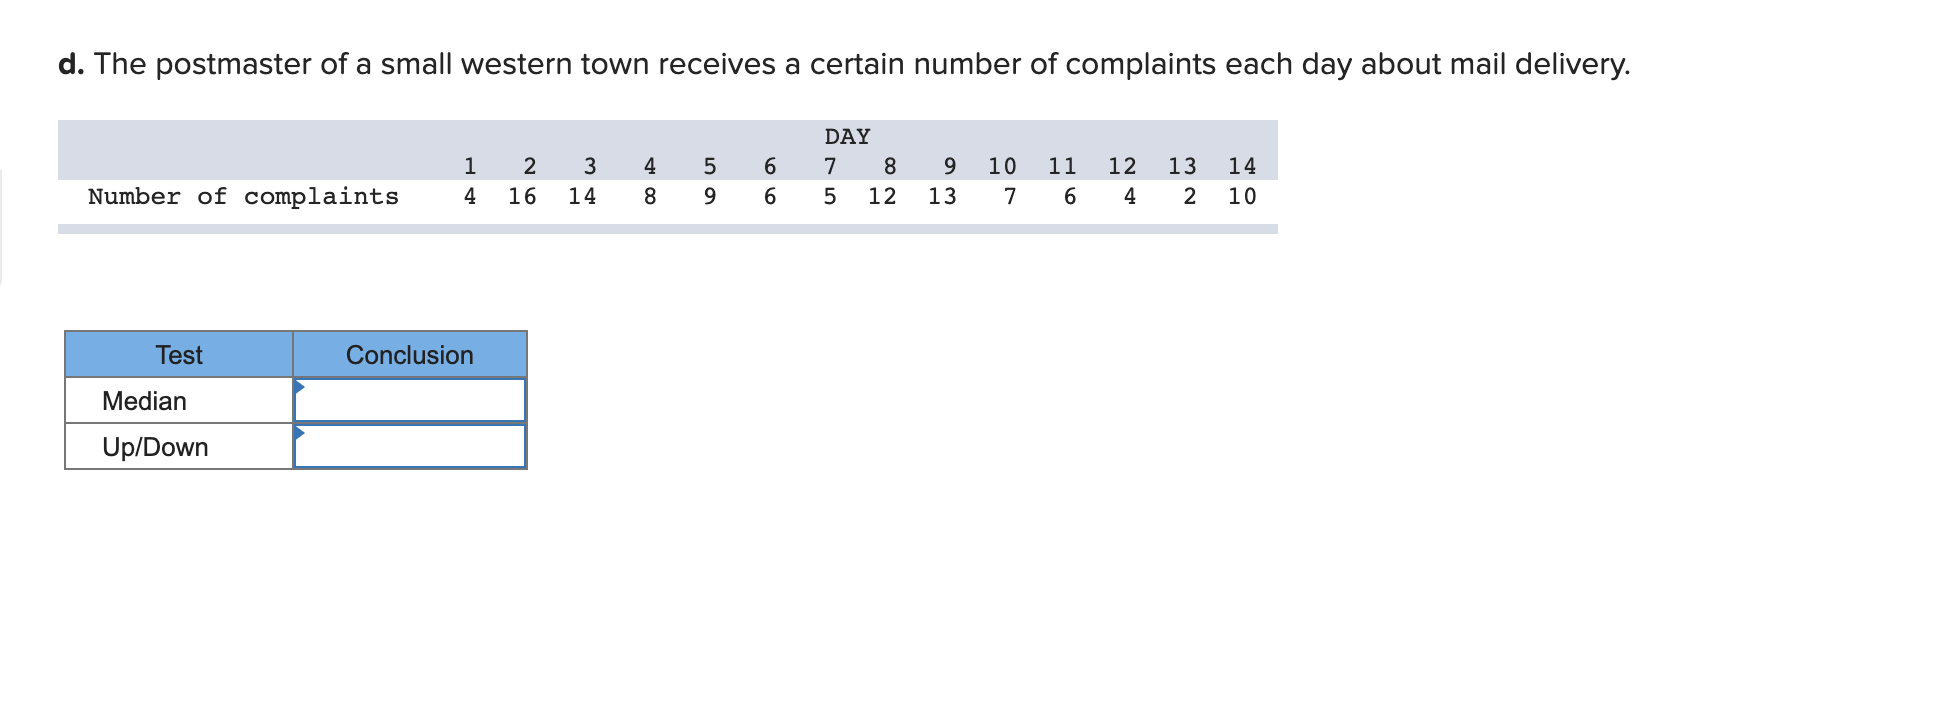
Analyze the data in the following problems using median and up/down run tests with z = 2. a. Given the following run test results of process output, what do the results of the run tests suggest about the process? Test Median z-score +1.50 Up/Down +1.06 random O non-random b. Twenty means were plotted on a control chart. An analyst counted 9 runs above/below the median, and 7 up/down runs. What do the results suggest about the process? non-random random c. The following data are the number of defects per spool of cable. Number of defects 13 23 51 40 3 1 OBSERVATION 8 9 10 11 6 7 3 2 0 22 11 1 13 12 13 1 32 14 0 c. The following data are the number of defects per spool of cable. Number of defects 1 3 3 23 OBSERVATION 3 4 5 1 0 1 6 3 7 8 2 0 92 10 1 Test Conclusion Median Up/Down 13 11 L 21 12 13 14 2 0 d. The postmaster of a small western town receives a certain number of complaints each day about mail delivery. 1 Number of complaints 26 2 4 16 14 34 4 8 DAY 75 66 59 8 12 13 03 9 10 11 12 13 14 7 6 4 2 10 d. The postmaster of a small western town receives a certain number of complaints each day about mail delivery. 1 Number of complaints 4 16 26 Test Conclusion Median Up/Down DAY 6 7 8 9 10 11 12 13 66 82 23 5 12 13 764 3 4 5 14 896 14 2 10
Step by Step Solution
There are 3 Steps involved in it
Step: 1

Get Instant Access to Expert-Tailored Solutions
See step-by-step solutions with expert insights and AI powered tools for academic success
Step: 2

Step: 3
Ace Your Homework with AI
Get the answers you need in no time with our AI-driven, step-by-step assistance
Get Started
Essentials of Management
Authors: Andrew J. DuBrin
9th Edition
538478233, 2900538478235, 978-0538478236